
Snowball Analytics Review: Features, Pricing & 10% Discount


Snowball Analytics has quickly become a favourite among dividend-focused investors looking for a comprehensive portfolio tracking solution. With support for multiple asset classes, powerful dividend analytics, and home screen widgets that display your net worth at a glance, it offers features that many competitors simply cannot match.

Exclusive Offer: MatchMyBroker readers get 10% off any Snowball Analytics plan using our link or code KAI at checkout. The discount appears after you create your free account and log in.
We spent several weeks testing Snowball Analytics across different devices and portfolio types to evaluate whether it lives up to its growing reputation. In this review, we cover everything you need to know: the standout features, notable limitations, pricing structure, and how it compares to alternatives like Delta Investment Tracker and Getquin.
What Is Snowball Analytics?
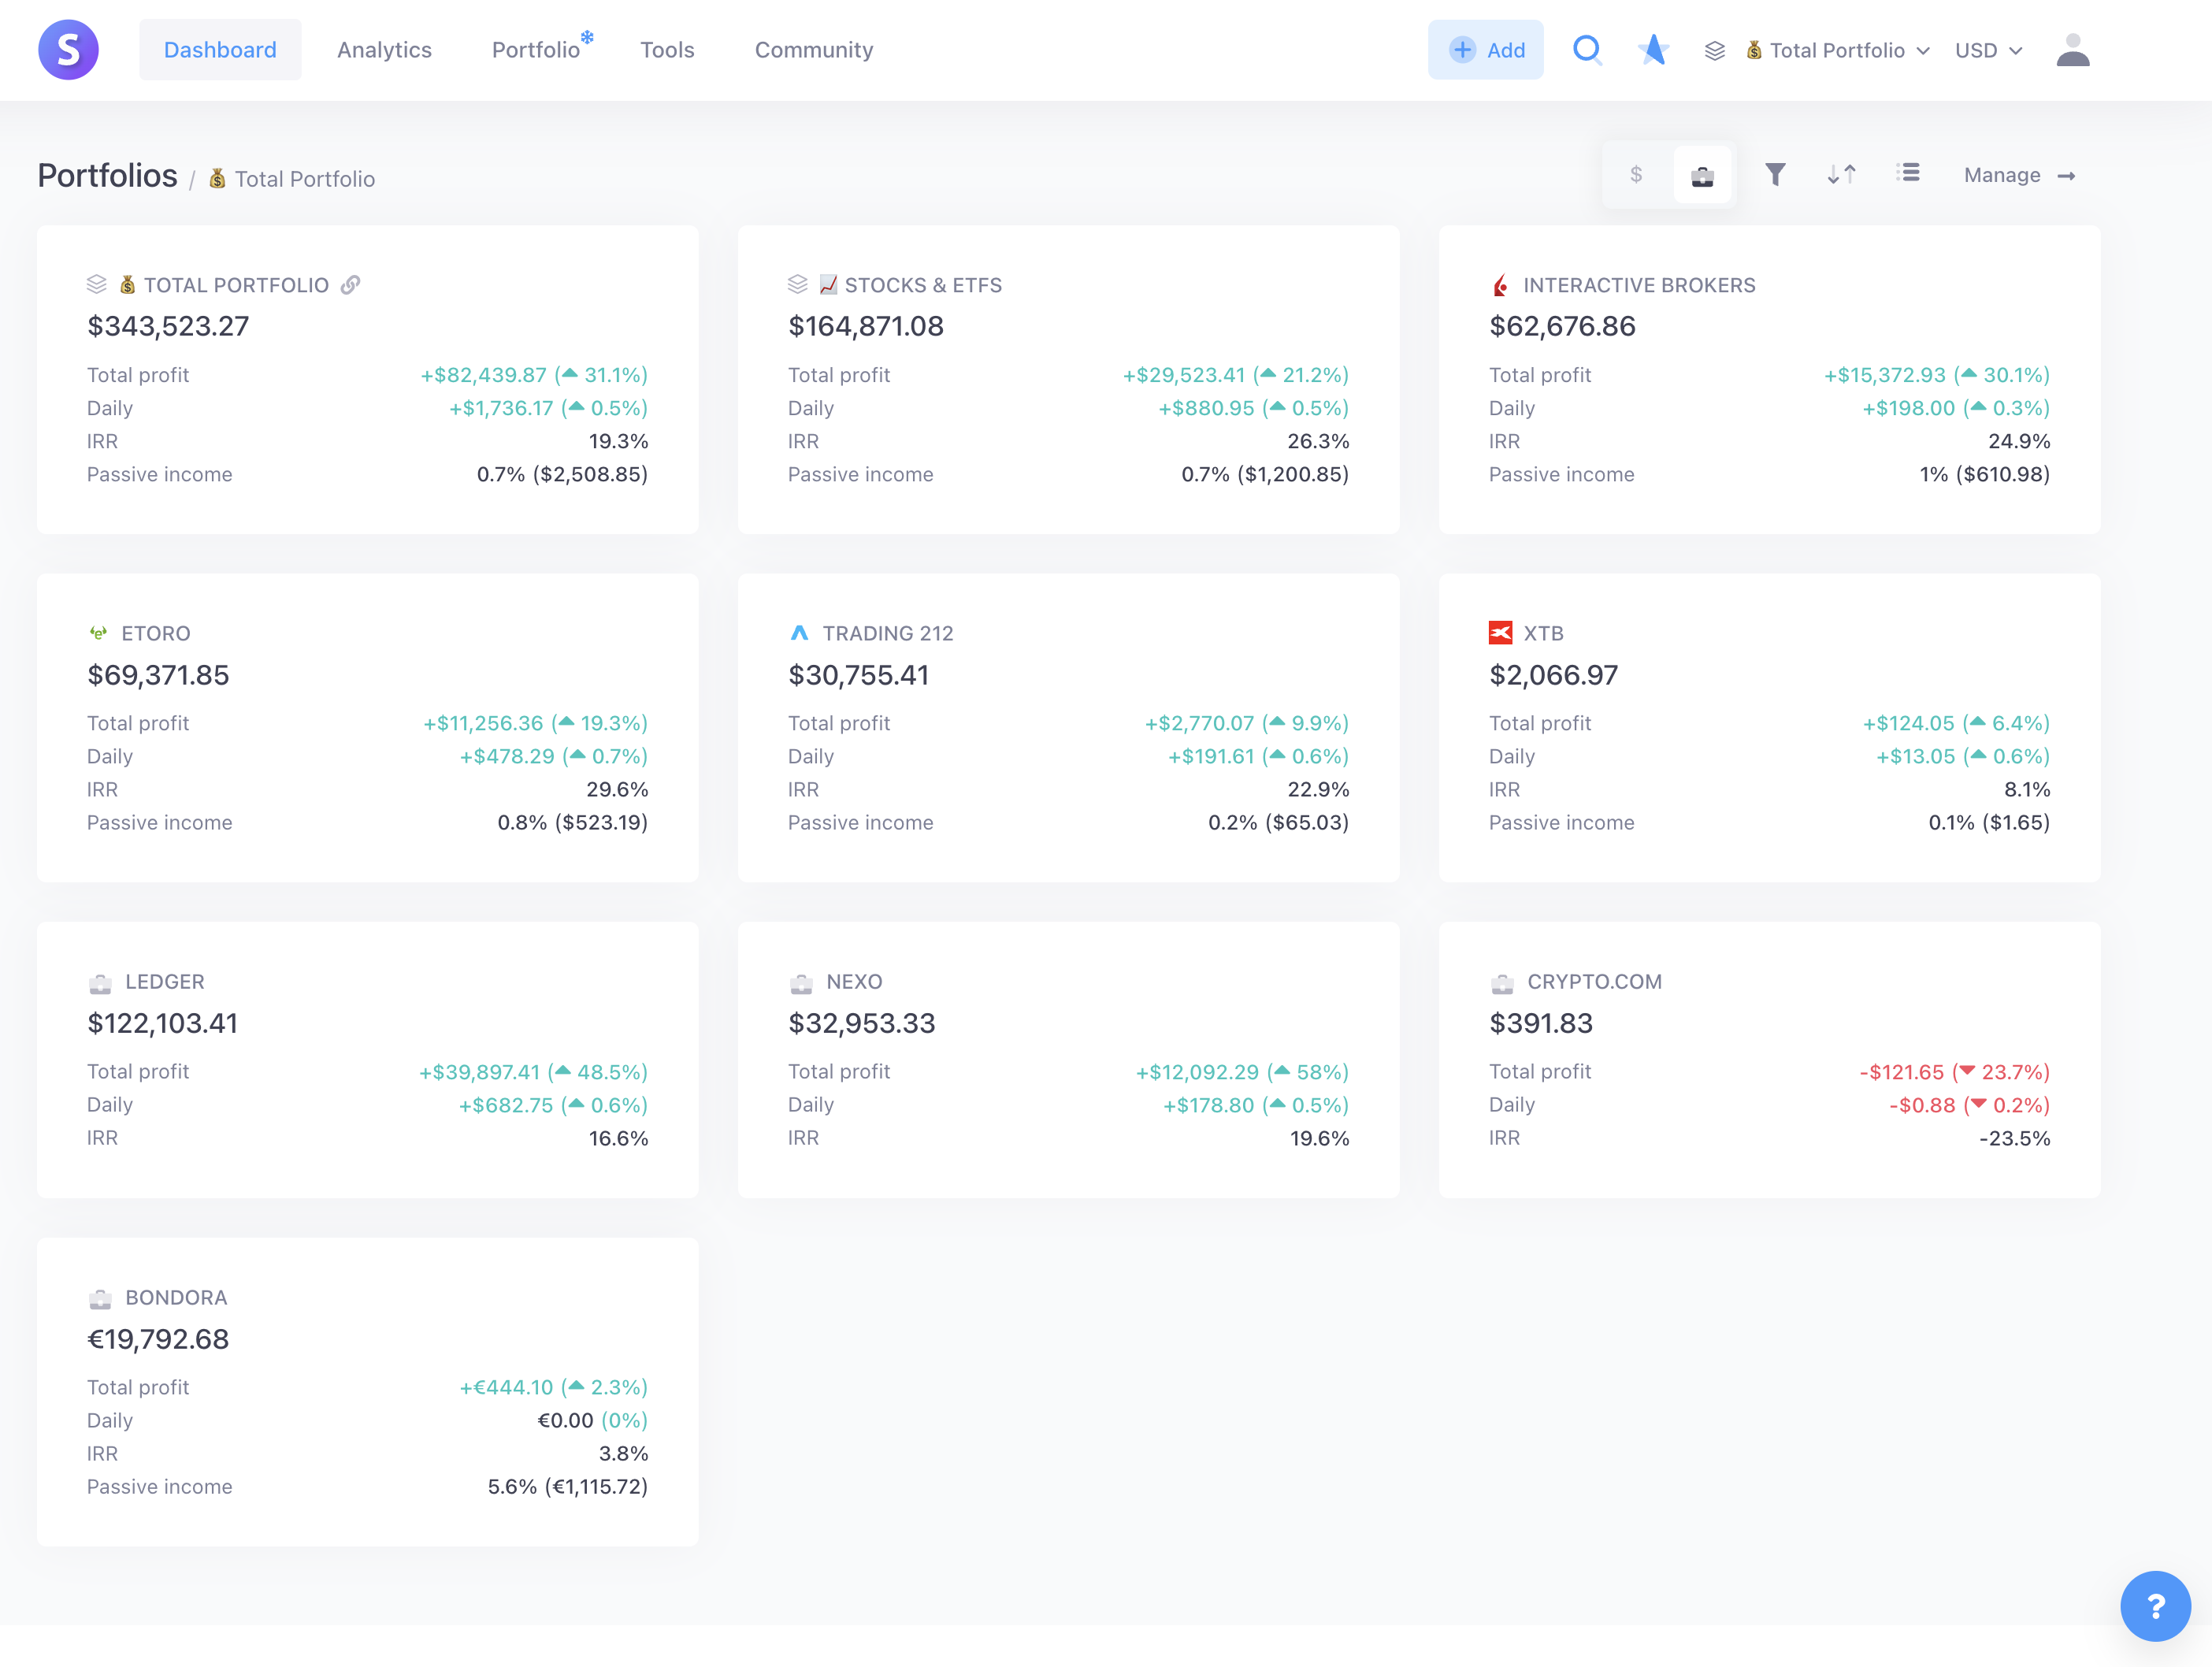
Snowball Analytics is a portfolio tracking platform developed by a France-based company that helps investors consolidate all their investments in one place. Unlike basic portfolio trackers that focus solely on stocks, Snowball Analytics supports an impressive range of asset classes: stocks, ETFs, mutual funds, cryptocurrencies, bonds, real estate, precious metals, and even non-exchange-traded assets like loans and deposits.
The platform connects to over 1,000 brokers worldwide through integrations with Yodlee and SnapTrade, covering brokerages in the US, UK, Europe, and Asia. This makes it particularly appealing for international investors who hold accounts across multiple platforms and currencies.
Key Features We Tested
Dividend Tracking and Analytics
This is where Snowball Analytics truly excels. The dividend tracking capabilities are among the most comprehensive we have encountered in any portfolio tracker. The platform offers:
Dividend Calendar: A visual calendar showing upcoming dividend payment dates, ex-dividend dates, and historical payouts. You can forecast your dividend income for the entire year ahead, which is invaluable for income-focused investors planning their cash flow.
Dividend Rating System: Snowball has developed its own dividend rating methodology that assesses the financial health of dividend-paying companies. This helps identify potentially risky dividend stocks before problems arise.
Income Forecasting: The platform projects your future dividend income based on your current holdings and historical dividend growth patterns. We found this particularly useful for retirement planning and setting income targets.
Dividend Growth Tracking: Monitor how your passive income grows over time with clear visualisations showing both actual payouts and projected growth.

Multi-Asset Class Support
One of Snowball's strongest advantages is its ability to track virtually any type of investment. During our testing, we successfully added:
- Stocks and ETFs from multiple global exchanges
- Cryptocurrency holdings
- Real estate investments (tracked as custom assets with rental income logged as income)
- Bonds with coupon payment tracking
- Precious metals
- P2P lending positions
- Bank deposits and savings accounts
This comprehensive coverage means you can see your true net worth across all asset classes in a single dashboard, rather than switching between multiple apps.
Mobile App and Widgets
The Snowball Analytics mobile app (available on iOS and Android) is polished and feature-rich. What sets it apart from many competitors is the home screen widget functionality. You can add widgets to your phone's home screen that display:
- Total portfolio value
- Daily/weekly/monthly performance
- Upcoming dividend payments
- Portfolio allocation breakdown
We found these widgets genuinely useful for checking portfolio performance at a glance without opening the full app. The iOS widgets launched in early 2025, with Android widgets now also available.

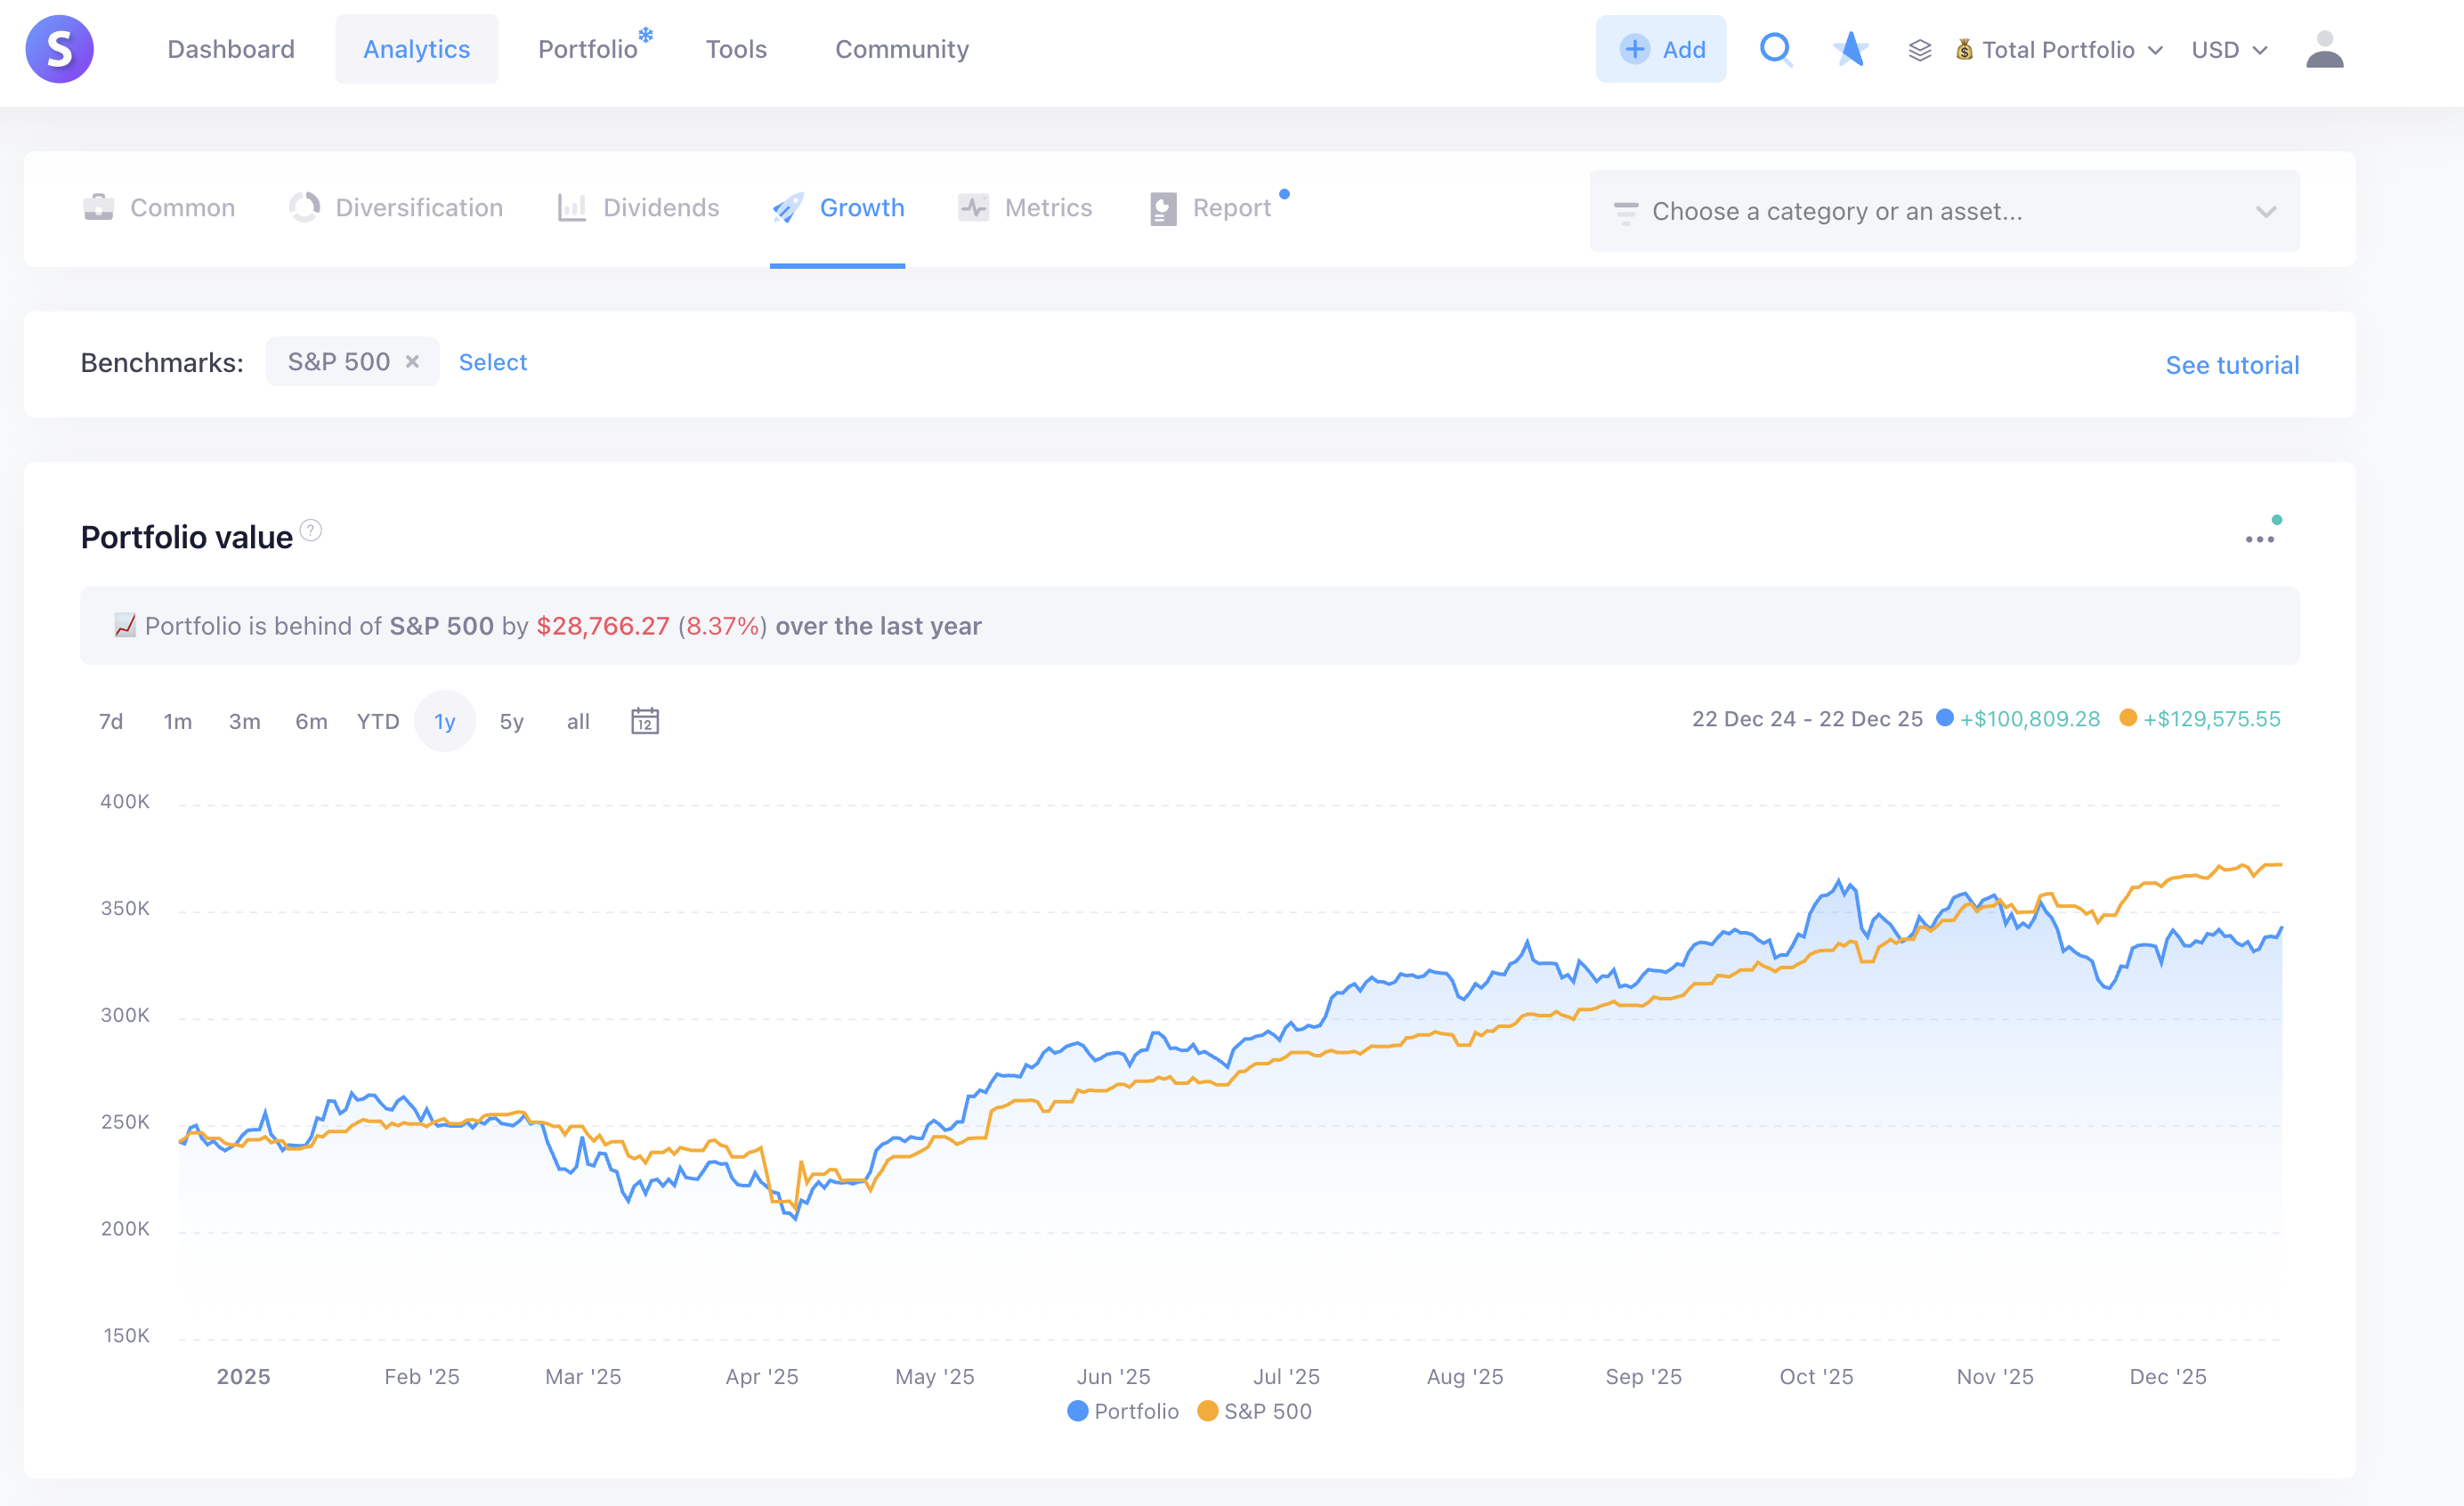
Performance Analytics
Beyond basic portfolio value tracking, Snowball offers sophisticated performance metrics including:
- True time-weighted returns accounting for deposits and withdrawals
- Fee impact analysis showing how much broker commissions affect your returns
- Benchmark comparisons against indices like the S&P 500, NASDAQ, FTSE, and TSX
- Sharpe ratio calculations for risk-adjusted return analysis
- Multi-currency support with performance shown in your native currency
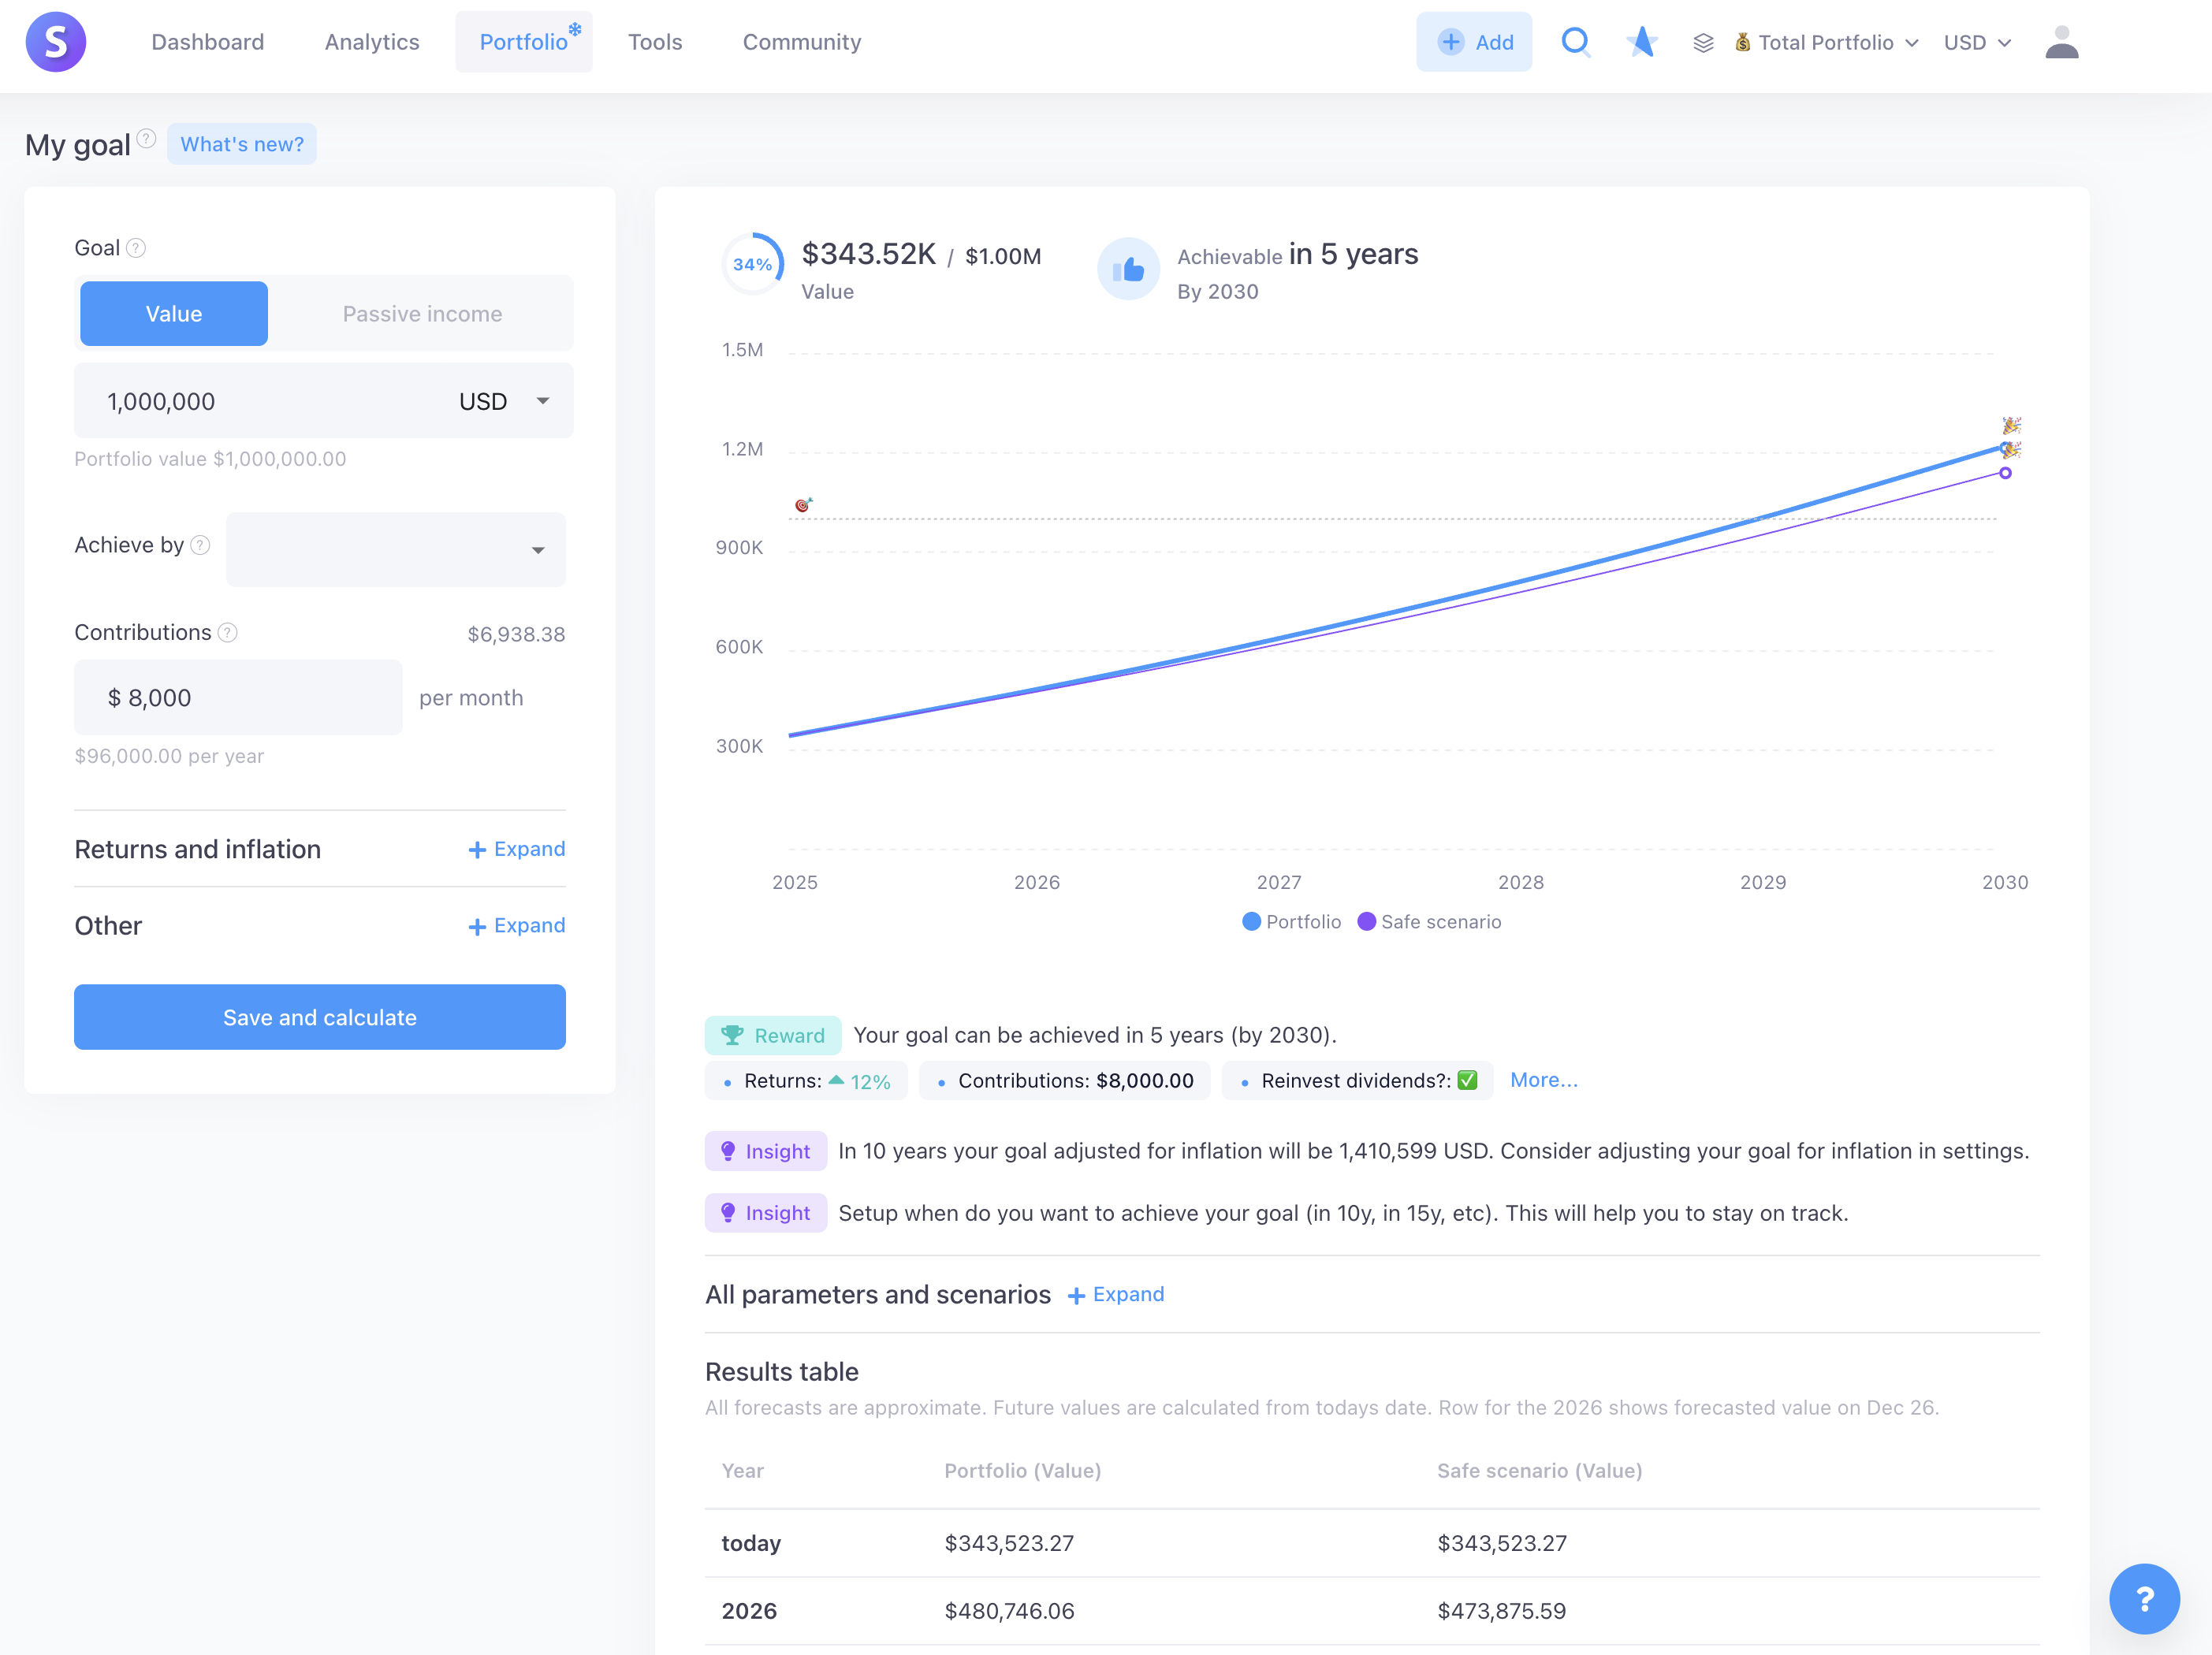
Portfolio Rebalancing Tools
The platform includes one-click rebalancing functionality that helps maintain your target asset allocation. You can set categories with target percentages and the system will show you exactly what adjustments are needed to stay on track.
Pricing and Plans
Snowball Analytics offers a freemium model with several paid tiers. All prices are in USD, and MatchMyBroker readers get 10% off any paid plan using our link or code KAI at checkout:
Free Plan: Limited features but useful for testing the platform. Includes 1 portfolio with up to 10 holdings, basic dividend calendar, and limited rebalancing tools.
Starter Plan: $79.99/year (or $71.99/year with code KAI). Includes 1 portfolio with unlimited holdings, the ability to link your brokerage accounts, advanced rebalancing tools, dividend rating, weekly summary emails, and up to 2 watchlists. This tier suits most individual investors just getting started.
Investor Plan: $149.99/year (or $134.99/year with code KAI). The most popular choice. Adds up to 10 portfolios, 10 watchlists, unlimited custom holdings, full benchmarking against any asset, 10 years of company fundamentals, 30+ years of backtesting data, and priority support.
Expert Plan: $249.99/year (or $224.99/year with code KAI) for serious investors who need unlimited portfolios, unlimited holdings, 20 watchlists, and priority support.
All paid plans include a 14-day free trial with no credit card required, which we recommend taking advantage of before committing. There is also a 16% discount when paying annually instead of monthly.
Get 10% Off Snowball Analytics →
| Feature | Free$0 | Starter$79.99/yr$71.99 with KAI | Investor$149.99/yr$134.99 with KAI |
|---|---|---|---|
| Portfolio Tracking | ✓ 1 portfolio | ✓ 1 portfolio | ✓ 10 portfolios |
| Holdings Limit | 10 holdings | ✓ Unlimited | ✓ Unlimited |
| Dividend Calendar | ✓ | ✓ | ✓ |
| Dividend Rating | ✗ | ✓ | ✓ |
| Link Brokerage | ✗ | ✓ | ✓ |
| Rebalancing Tools | Purchases only | ✓ Full | ✓ Full |
| Benchmarking | Index funds | Index funds | ✓ Any asset |
| Portfolio Backtesting | 10 years | 10 years | ✓ 30+ years |
| Company Fundamentals | 5 years | 5 years | ✓ 10 years |
| Watchlists | ✓ 1 | ✓ 2 | ✓ 10 |
| Custom Assets | ✓ 1 | ✓ 5 | ✓ Unlimited |
| Support | Basic | Basic | ✓ Priority |
What We Like About Snowball Analytics
Outstanding Dividend Analytics: The dividend tracking features are genuinely best-in-class. The calendar, forecasting, and dividend health ratings provide insights that most competitors simply do not offer.
Comprehensive Asset Coverage: Being able to track stocks, crypto, real estate, bonds, and alternative investments in one place eliminates the need for multiple tracking tools.
Excellent Mobile Experience: The app is well-designed with useful widgets that provide genuine day-to-day utility for checking your portfolio.
Strong Broker Connectivity: With 1,000+ broker connections and support for manual CSV imports from many more, getting your data into Snowball is straightforward.
Active Development: The team releases regular updates and responds to user feedback. New features like the "Why is it moving" news feature demonstrate ongoing improvement.
Multi-Currency Support: Track investments across 30+ currencies with automatic conversion to your preferred base currency.
What Could Be Better
No Real-Time Pricing: This is Snowball's most significant limitation. Stock prices are delayed (the exact delay depends on data sources), which means you cannot use it for intraday trading decisions or precise real-time valuation. The platform explicitly states that data "is not necessarily real-time nor accurate." For buy-and-hold investors this is rarely problematic, but active traders will find it frustrating.
Learning Curve: The sheer number of features can feel overwhelming for new users. The interface has improved, but first-time users may need time to discover all the platform's capabilities.
Real Estate Tracking Limitations: While you can add real estate as custom assets and log rental income, the platform does not treat property as a first-class asset type with dedicated features for mortgage tracking, property-specific analytics, or location-based categorisation.
Limited Report Customisation: The built-in reports are useful but offer limited customisation options. Power users who want highly tailored analytics may find this restrictive.
English Only: The interface is currently only available in English, which may limit accessibility for non-English speakers.
How Snowball Analytics Compares to Alternatives
When choosing a portfolio tracker, it helps to understand how Snowball stacks up against similar tools. We compared it to two popular alternatives:
Delta Investment Tracker: Delta has traditionally focused more heavily on cryptocurrency tracking with unlimited exchange connections. It offers real-time pricing for crypto assets and a slick mobile-first design. However, its dividend tracking is less sophisticated than Snowball's, making it better suited for crypto-focused investors rather than dividend investors.
Getquin: Getquin emphasises social features and community aspects, allowing users to share portfolios and follow other investors. It supports multiple asset classes but with less depth in dividend analytics. If community interaction and social investing features matter to you, Getquin may be preferable, but pure tracking and analytics favour Snowball.
Who Should Use Snowball Analytics?
Based on our testing, Snowball Analytics is best suited for:
- Dividend investors who want detailed income tracking, forecasting, and company health analysis
- Multi-asset investors holding stocks, ETFs, crypto, real estate, and other asset types who want everything in one dashboard
- International investors with accounts across multiple brokers and currencies
- Long-term investors focused on portfolio growth rather than day trading
- Income-focused retirees or those planning for retirement who need accurate dividend projections
It may not be ideal for:
- Active day traders who require real-time pricing data
- Crypto-only investors who might prefer Delta's deeper cryptocurrency features
- Users seeking social features who would benefit more from Getquin's community aspects
Getting Started with Snowball Analytics
The platform supports imports from over 15 brokers directly and thousands more through aggregator connections. If your broker is not directly supported, the CSV import feature handles most standard formats.
Our Verdict
Snowball Analytics has earned its reputation as one of the best portfolio trackers for dividend-focused investors. The depth of dividend analytics, combined with genuine multi-asset support and excellent mobile widgets, makes it a compelling choice for anyone building a long-term investment portfolio.
The lack of real-time pricing is a genuine limitation, but for the platform's target audience of buy-and-hold and dividend investors, this rarely matters in practice. The pricing is reasonable, starting at $79.99/year for the Starter plan (or $71.99/year with our exclusive 10% discount), and the free trial allows thorough testing before commitment.
If dividend tracking and comprehensive net worth monitoring are your priorities, Snowball Analytics deserves serious consideration. For investors focused primarily on cryptocurrency, Delta Investment Tracker may serve you better. Those seeking community features should explore Getquin. And if you are still deciding which broker to use for your investments, our broker matching tool can help you find the right platform for your needs.
Get 10% Off Snowball Analytics with Code KAI →
Frequently Asked Questions
Is Snowball Analytics free to use?
Snowball Analytics offers a free plan with limited features (1 portfolio, 10 holdings), plus a 14-day free trial of premium features. Paid plans start from $79.99/year for Starter, or $71.99/year with our exclusive code KAI. The free tier allows basic portfolio tracking but restricts access to advanced dividend analytics, brokerage linking, and other premium features.
Does Snowball Analytics support UK brokers?
Yes, Snowball Analytics connects to over 1,000 brokers worldwide, including major UK platforms. If direct connection is not available for your broker, you can import transactions via CSV files. The platform supports 30+ currencies including GBP as a base currency for UK investors.
Can I track cryptocurrency in Snowball Analytics?
Snowball Analytics supports cryptocurrency tracking alongside traditional investments. You can add crypto holdings manually or through connected accounts. However, if crypto is your primary focus, you might want to compare it with Delta Investment Tracker, which offers more specialised crypto features.
Does Snowball Analytics show real-time stock prices?
No, Snowball Analytics does not provide real-time pricing. Stock and ETF prices are delayed, which is one of the platform's main limitations. This makes it unsuitable for day trading but is typically acceptable for long-term investors focused on portfolio performance over weeks, months, and years.
How does Snowball Analytics compare to Getquin?
Both platforms support multi-asset tracking, but they have different strengths. Snowball Analytics excels at dividend tracking and analytics, while Getquin emphasises community features and social portfolio sharing. Your choice depends on whether detailed analytics or social interaction matters more to you.
Is my data secure with Snowball Analytics?
Snowball Analytics uses industry-standard encryption and connects to brokers through established aggregators like Yodlee and SnapTrade. The platform does not store your broker login credentials directly. All data is depersonalized and encrypted at rest. The company is based in France and operates as Snowball Analytics SAS.
Can I track real estate investments in Snowball Analytics?
Yes, you can add real estate as a custom asset type, manually updating property valuations and logging rental income. The number of custom assets depends on your plan: 1 on Free, 5 on Starter, and unlimited on Investor and Expert plans. However, the platform does not offer dedicated real estate features like mortgage tracking or property-specific analytics.
How do I get the 10% discount on Snowball Analytics?
MatchMyBroker readers can get 10% off any Snowball Analytics paid plan. Simply sign up through our link or use code KAI at checkout. The discount becomes visible after you create your free account and log in to the pricing or checkout page.
Risk Disclaimer. Investment tracking tools like Snowball Analytics provide analytical information to help you monitor your portfolio but do not constitute financial advice. Past performance shown in any portfolio tracker is not indicative of future results. The value of investments can go down as well as up, and you may lose some or all of your initial investment. Always conduct your own research and consider seeking advice from a qualified financial advisor before making investment decisions.