How to Find Undervalued Stocks With InvestingPro (5 Steps)



Every undervalued-stock screen leaves you with the same problem: a list of companies the market has marked down, and no way of telling from the list alone which discounts are mistakes and which are verdicts. A price can sit far below estimated value because the market is wrong, or because the business is deteriorating, and the results table looks identical either way.
InvestingPro supplies the structure, and we recommend it for that role on one condition. Screener results, Fair Value, Financial Health, analyst targets, and WarrenAI are research inputs rather than buy signals, and the final call rests on the company's own filings. Used with that discipline, the platform turns a long list of cheap-looking names into a short, five-step process that ends with you inside a primary document, writing down a decision.
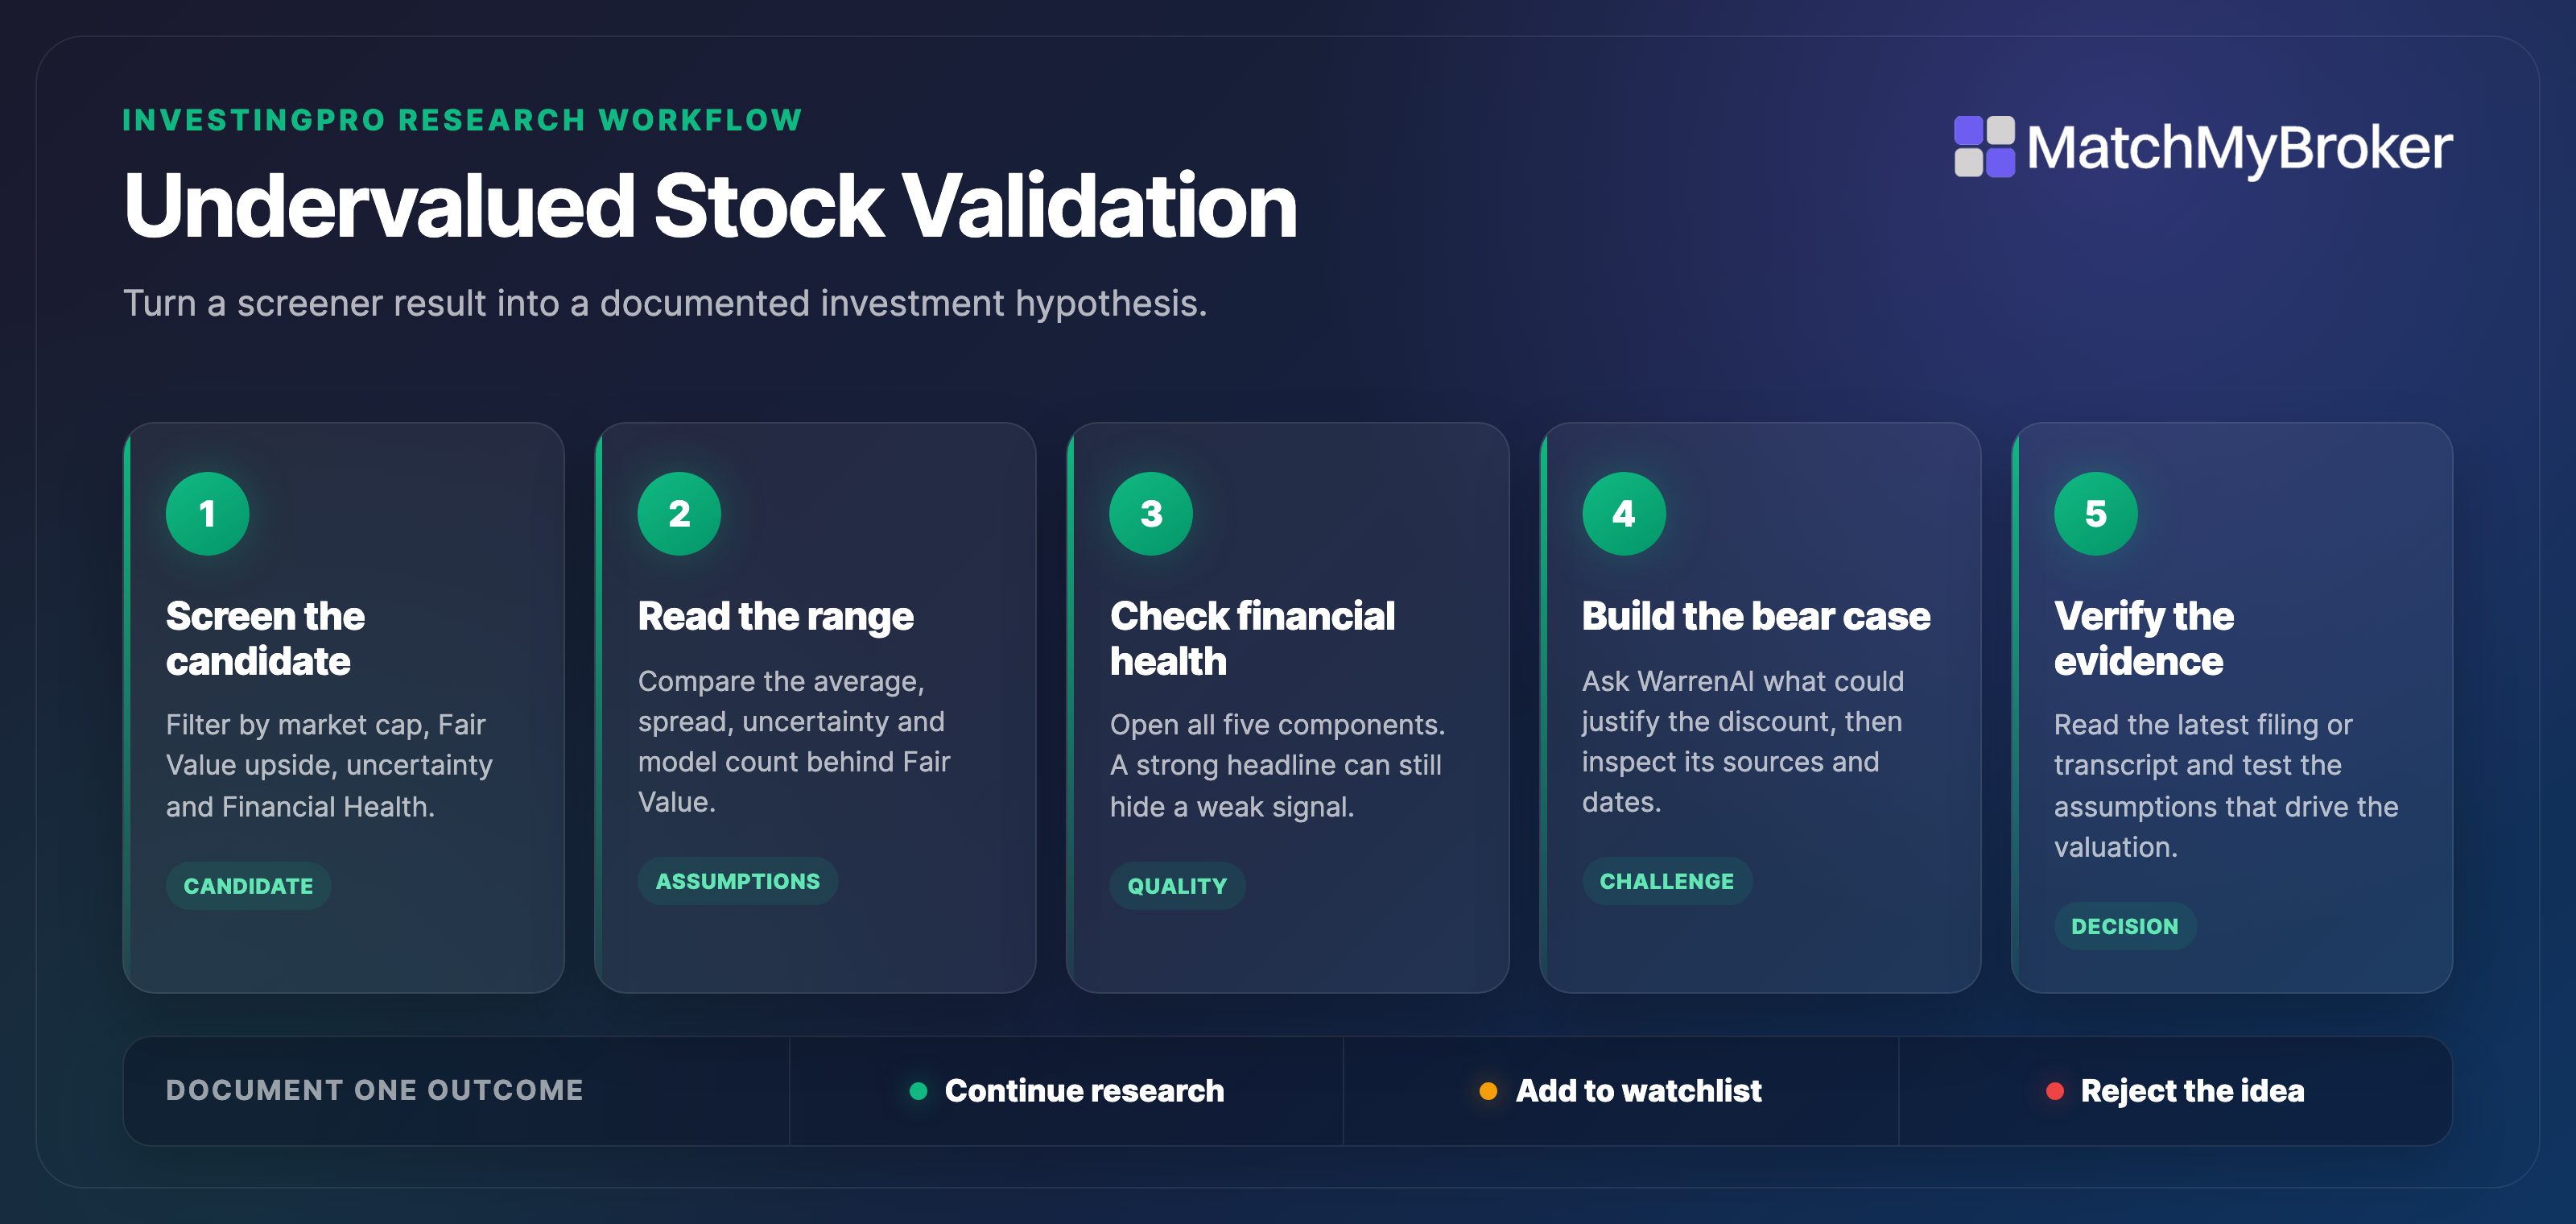
The workflow has five steps:
- Build a focused undervalued-stock screen.
- Read Fair Value as a range, never a single target.
- Open the Financial Health components.
- Make WarrenAI surface the opposing case and possible source leads.
- Verify the case in the latest filing and record a decision.
The order matters. Each step exists to kill a weak idea cheaply before the next one costs you real time, and a candidate that survives all five has earned a written decision rather than a purchase.
We use Adobe as the worked example throughout because its screen result contains a built-in disagreement worth resolving. Every Adobe figure below comes from one signed-in InvestingPro session captured on 22 July 2026 and will have moved since; the screenshots carry the dated evidence, and nothing in this article is a recommendation to buy or sell the stock.
Step 1. Build a focused undervalued-stock screen
InvestingPro gives you two starting points: a public Most Undervalued list and a custom screener that combines Fair Value upside with market capitalisation, Financial Health, sector, and geography. Treat both as candidate generators, because the lists move with prices and model inputs, and the job at this stage is to pull out a handful of names worth real work.
Resist sorting by headline upside and working from the top. An extreme implied discount deserves extra scrutiny, since structural decline, unusual accounting, stale inputs, or a poor model fit can each produce a false positive with a spectacular number attached. Build the screen to narrow: set a minimum market capitalisation, require a solid Financial Health score, and restrict results to sectors and regions you can evaluate. The goal is a list short enough that you will research every name on it.

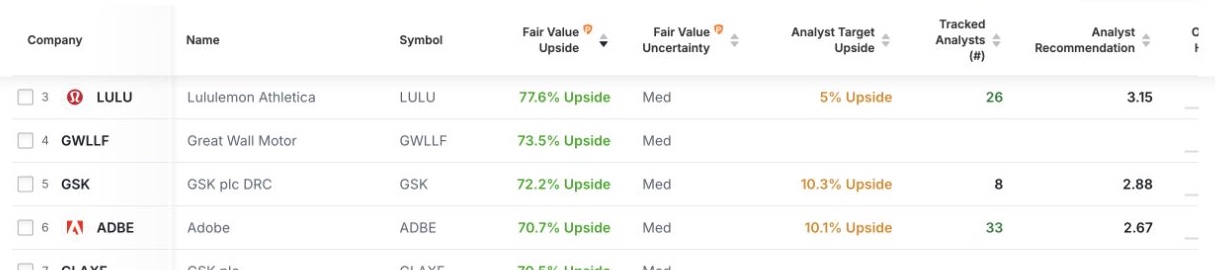
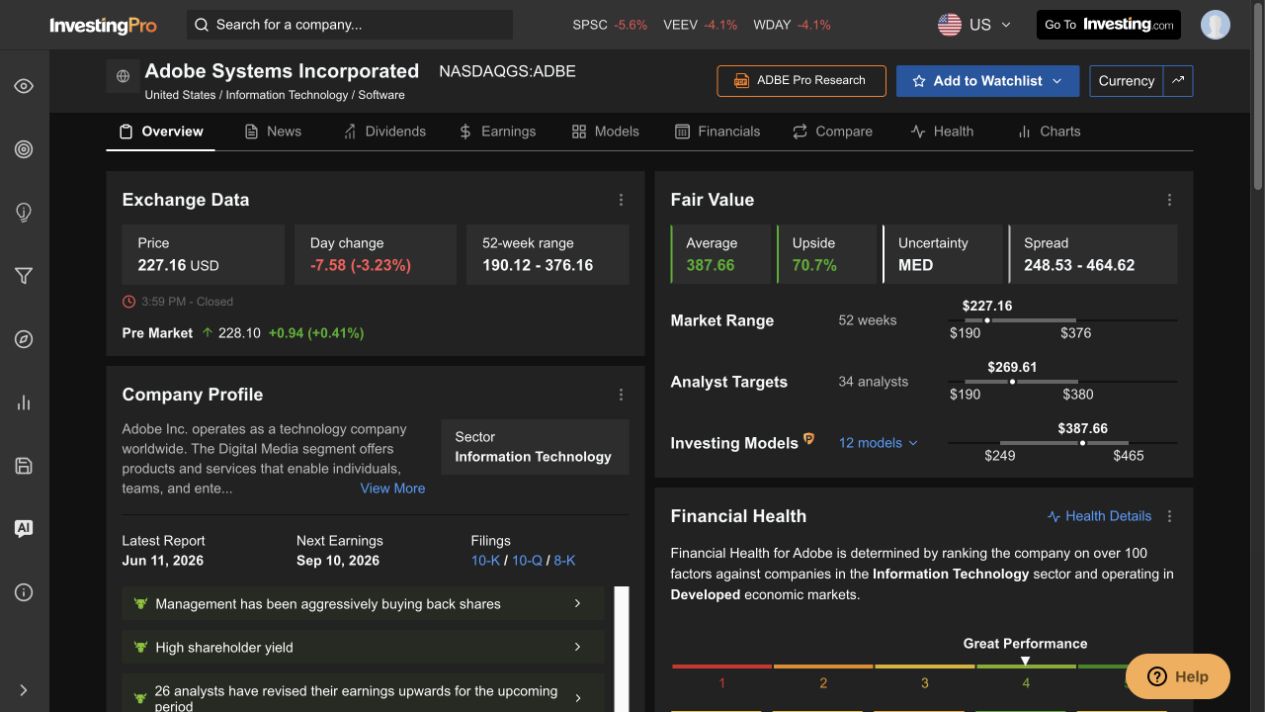
Our large-cap screen surfaced Adobe with a Great Financial Health label, 70.7% Fair Value upside, and 10.1% upside to the average target of the 33 analysts covering it. A gap of roughly 60 percentage points between two credible inputs gives you a concrete starting point: it converts a vague sense of cheapness into a specific question about whose assumptions to trust.
Step 2. Read Fair Value as a range, not a target
Read the whole Fair Value display. InvestingPro draws on a pool of 17 valuation models and applies only the ones relevant to the company, which is why the screen shows an average, a range, an uncertainty rating, and the applicable model count together. For Adobe, 12 models produced a $387.66 average, a $248.53 to $464.62 range, and Medium uncertainty against a $227.16 price.
Two readings matter more than the average. Position first: Adobe's price sat below the entire range, so even the most conservative applicable model called the shares undervalued, while a price inside the range would be a weaker signal. Width second: a spread that wide, rated Medium by the platform itself, means the models disagree with each other, and an estimate carrying internal disagreement is a starting point for research rather than a target to trade against.
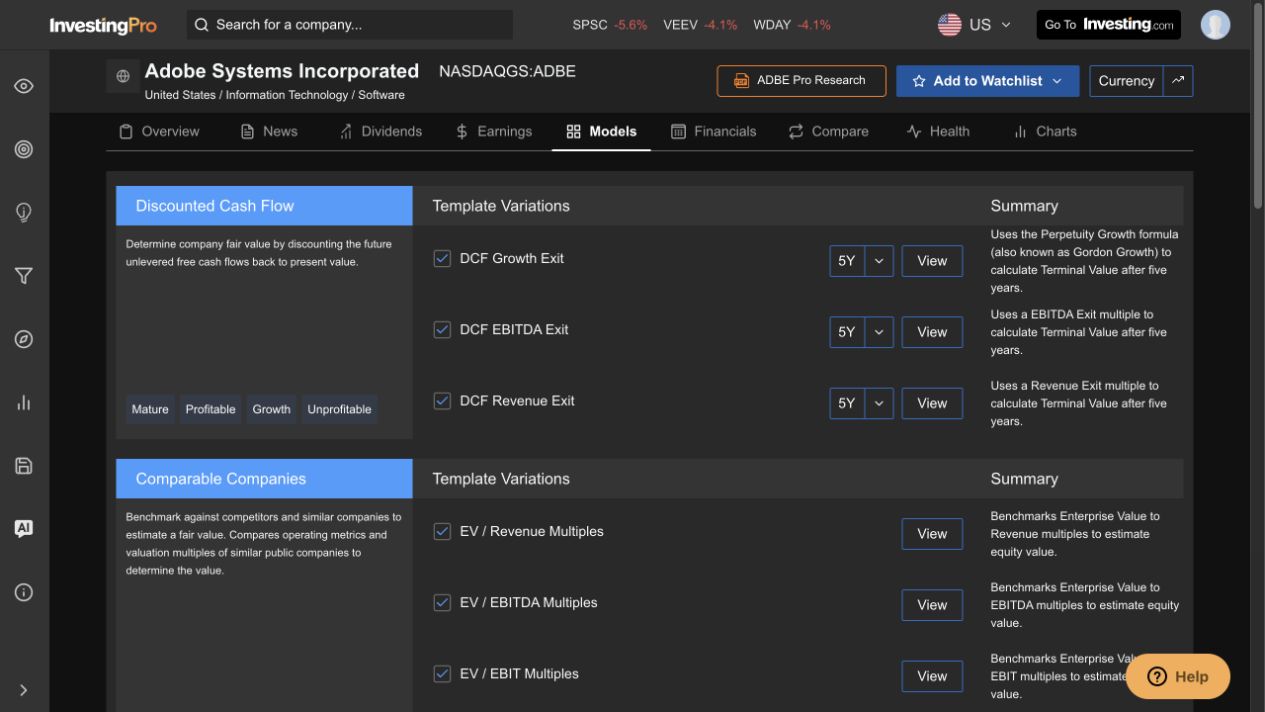
Open the model mix before moving on. An average built mostly on comparable-company multiples inherits whatever the peer group trades at, while one leaning on discounted cash flow rests on growth and discount-rate assumptions you will want to see. Checking which methods carry the estimate, and whether an obvious one is missing, takes two minutes and tells you how much weight the headline figure can bear. It also explains the screener gap: models price reported data, analysts anchor nearer the market, and the rest of this workflow decides which side the primary evidence supports.
Step 3. Diagnose the Financial Health score
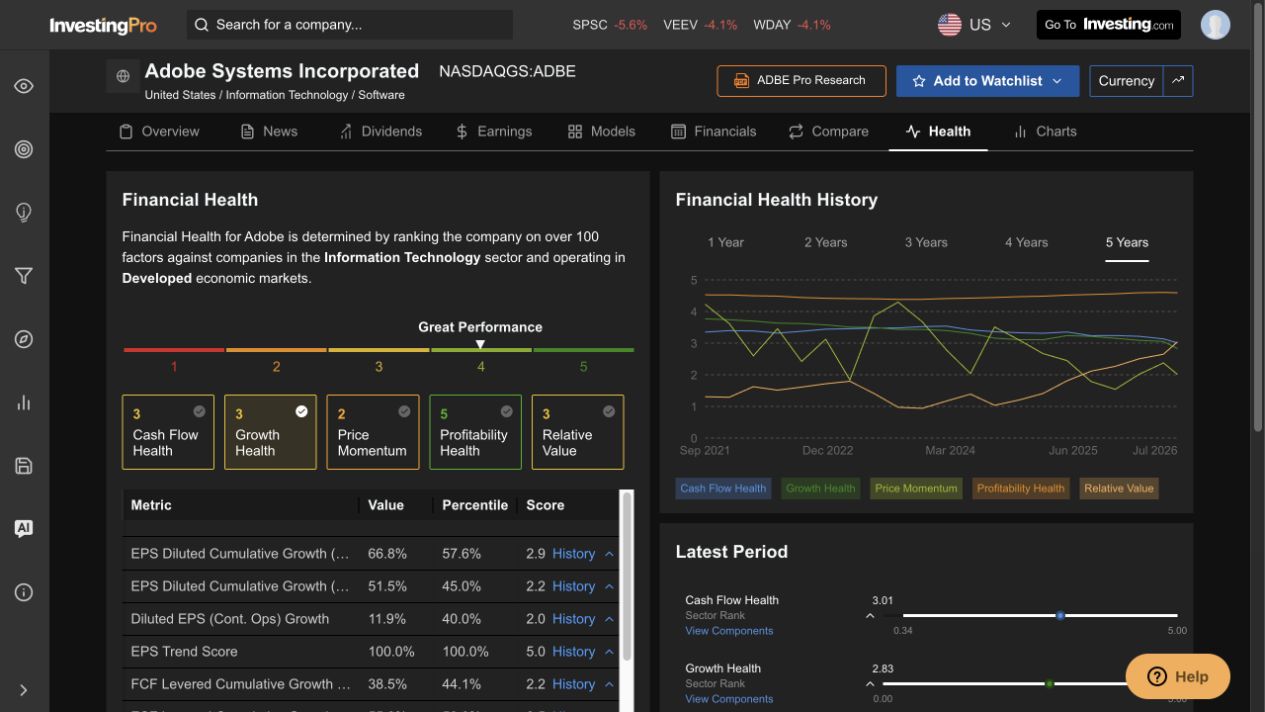
Financial Health condenses more than 100 factors into a 0 to 5 score across five dimensions: Cash Flow, Growth, Price Momentum, Profitability, and Relative Value, all measured relative to peers. The score ranks standing within a group rather than proving anything absolute about solvency, so open the components every time; the headline label can hide the one weakness your thesis depends on.
Adobe carried a Great label, and the breakdown ran from Profitability at 5 down to Price Momentum at 2. Strong measured profitability beside weak price momentum is the classic outline of a stock the market keeps marking down while the reported fundamentals still score well. Genuine bargains and value traps both look like this from the outside, which is why the score sharpens the question without settling it.
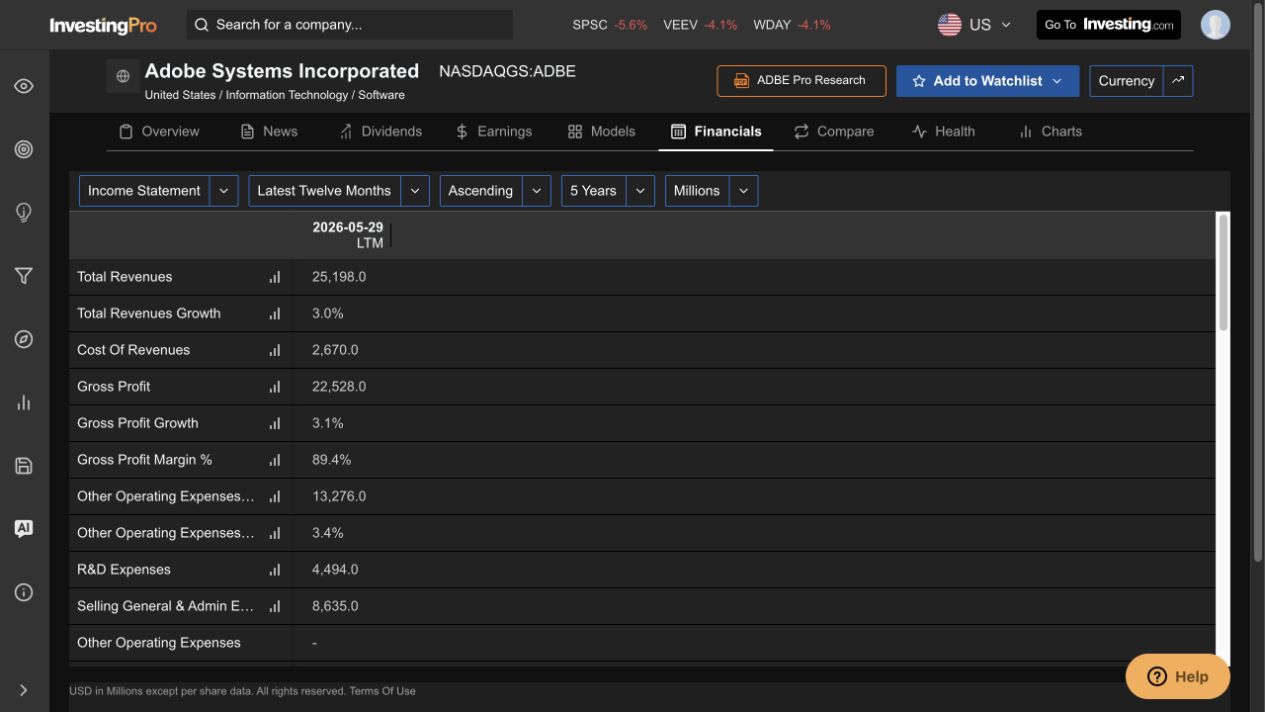
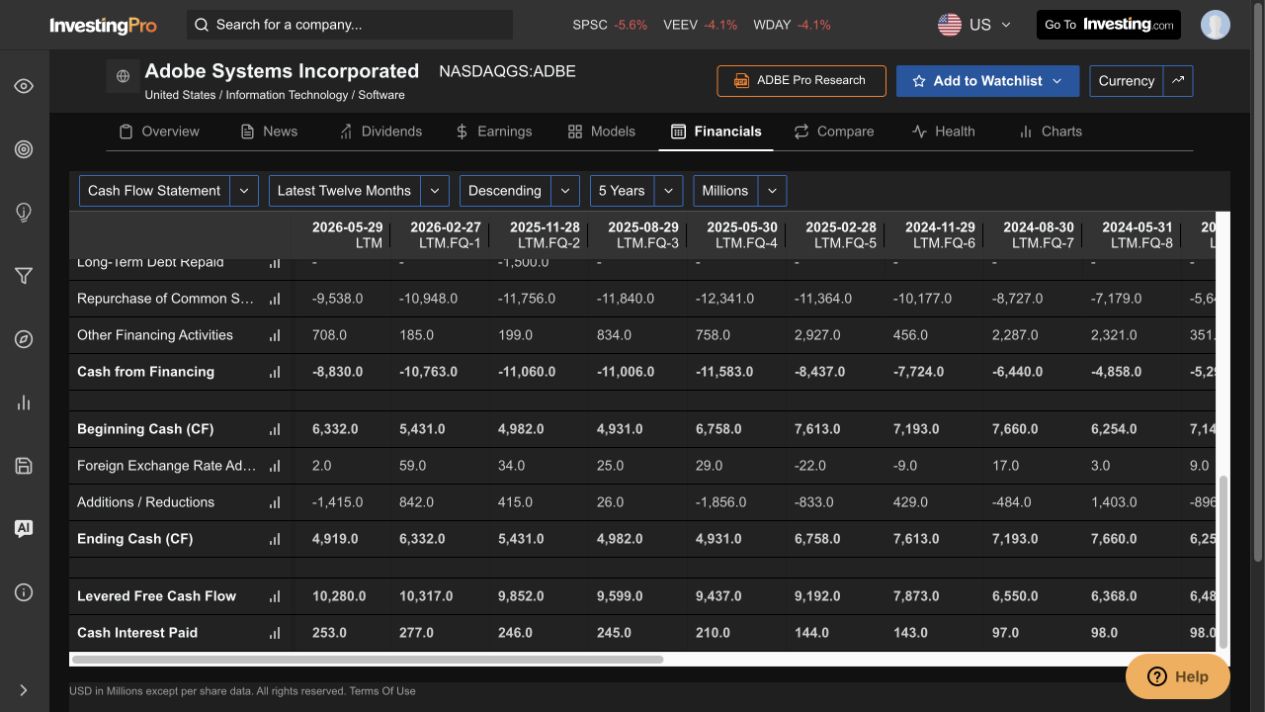
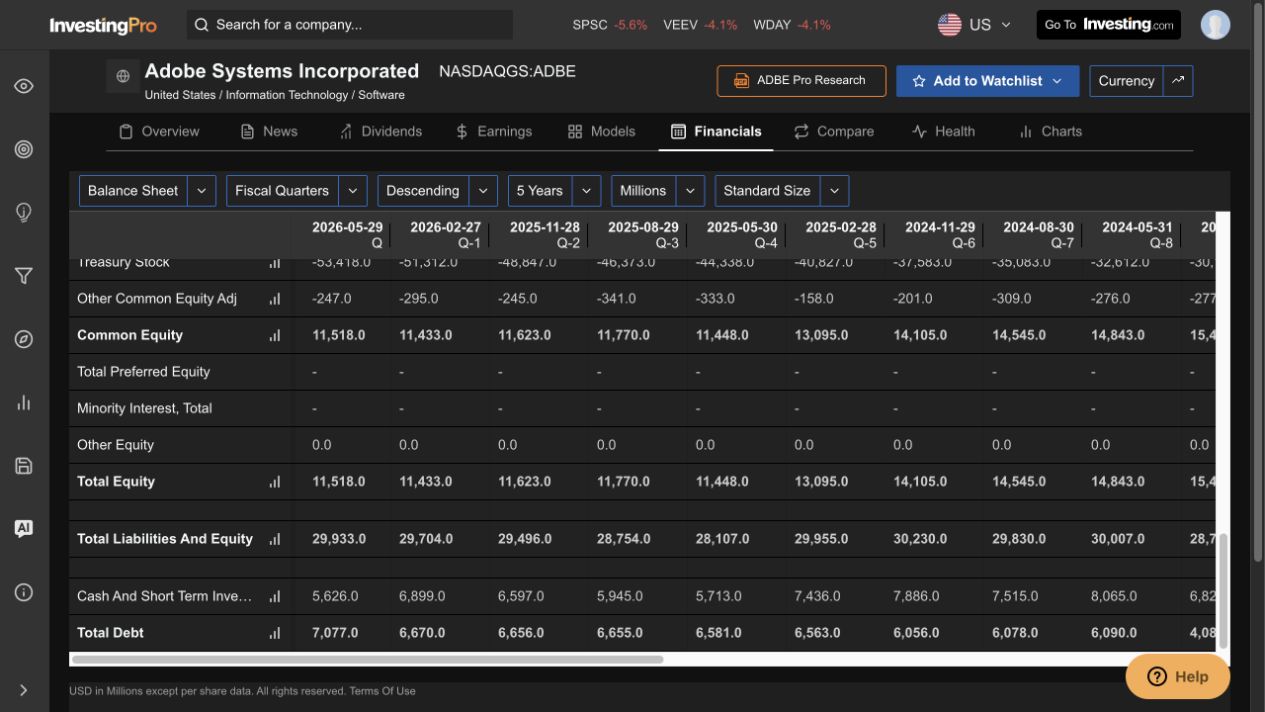
Pair the score with the dated financials behind it, where the value-trap checks run. Adobe's trailing free cash flow of $10.280 billion exceeded its $7.077 billion of debt, and that one comparison narrows the plausible bear case: a thesis built on balance-sheet distress has to argue with those figures, while one built on slowing growth or competitive pressure does not. Read the financials view with that sorting question in mind, and save the line-by-line audit for a candidate that has earned it.
Step 4. Make WarrenAI build the bear case
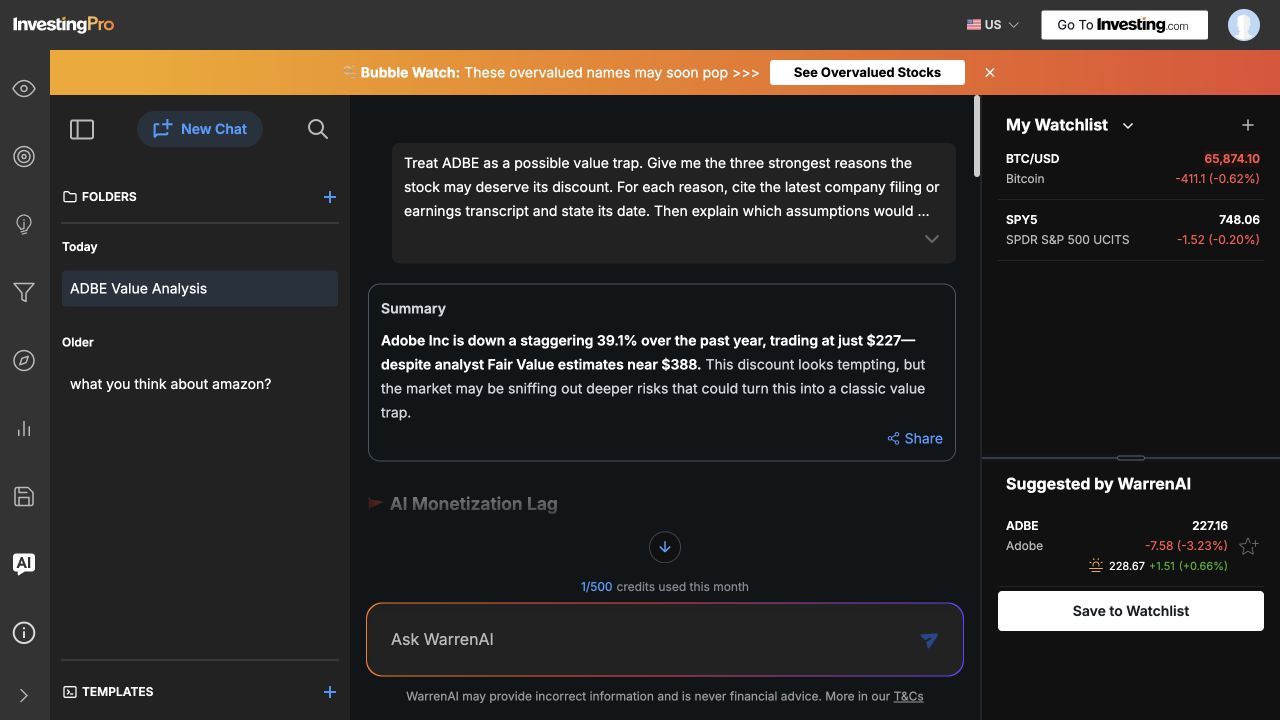
Everything so far came from tools that surfaced Adobe because it looked attractive, so this step reverses the direction. WarrenAI, the platform's beta research assistant, answers company questions and can cite source material, and we use it to build the case against the idea with one prompt:
Treat [ticker] as a possible value trap. Give me the three strongest reasons the stock may deserve its discount. For each reason, cite the latest company filing or earnings transcript and state its date. Then explain which assumptions would invalidate the current Fair Value case.
Our live Adobe run shows the pattern to expect. The response returned three risk themes, but it mixed analyst and news sources with filing and transcript references, so not every reason came with the latest company filing or earnings transcript the prompt asked for, and one earnings-call label and date looked inconsistent. Investing.com itself warns that output may contain errors or be incomplete or out of date, and frames the tool as a starting point, so we logged the three themes as hypotheses with source leads attached.
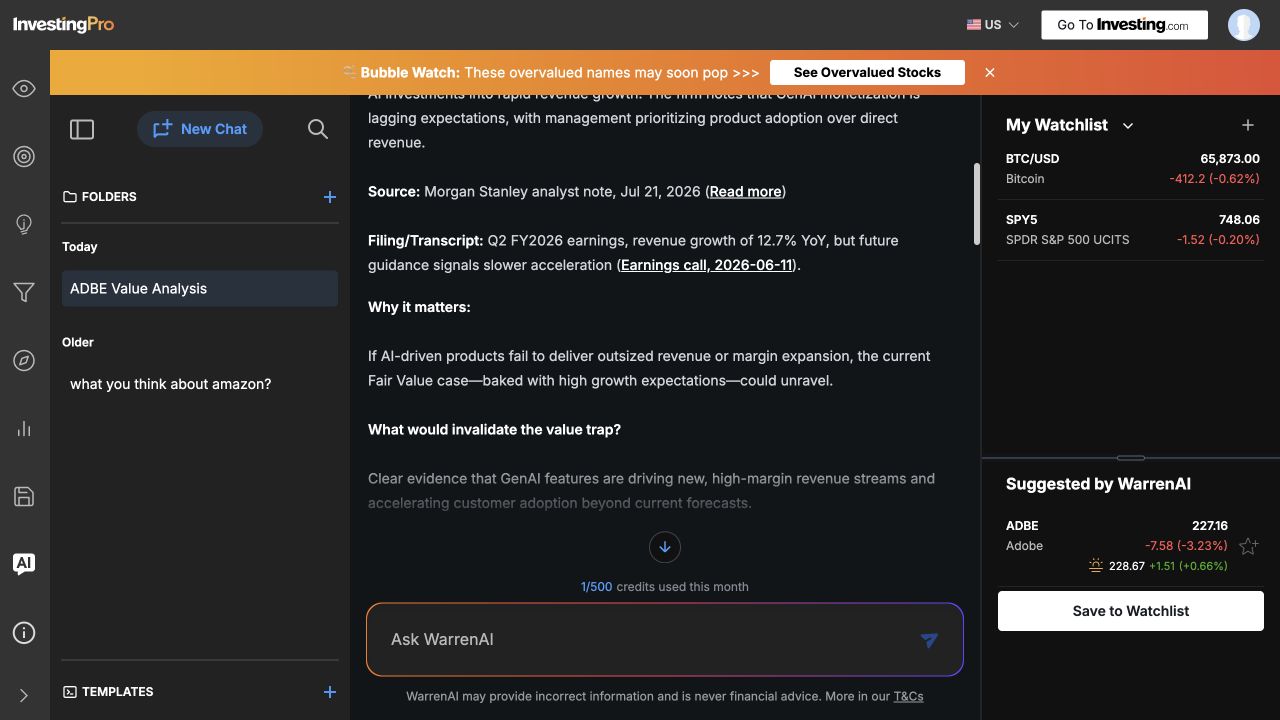
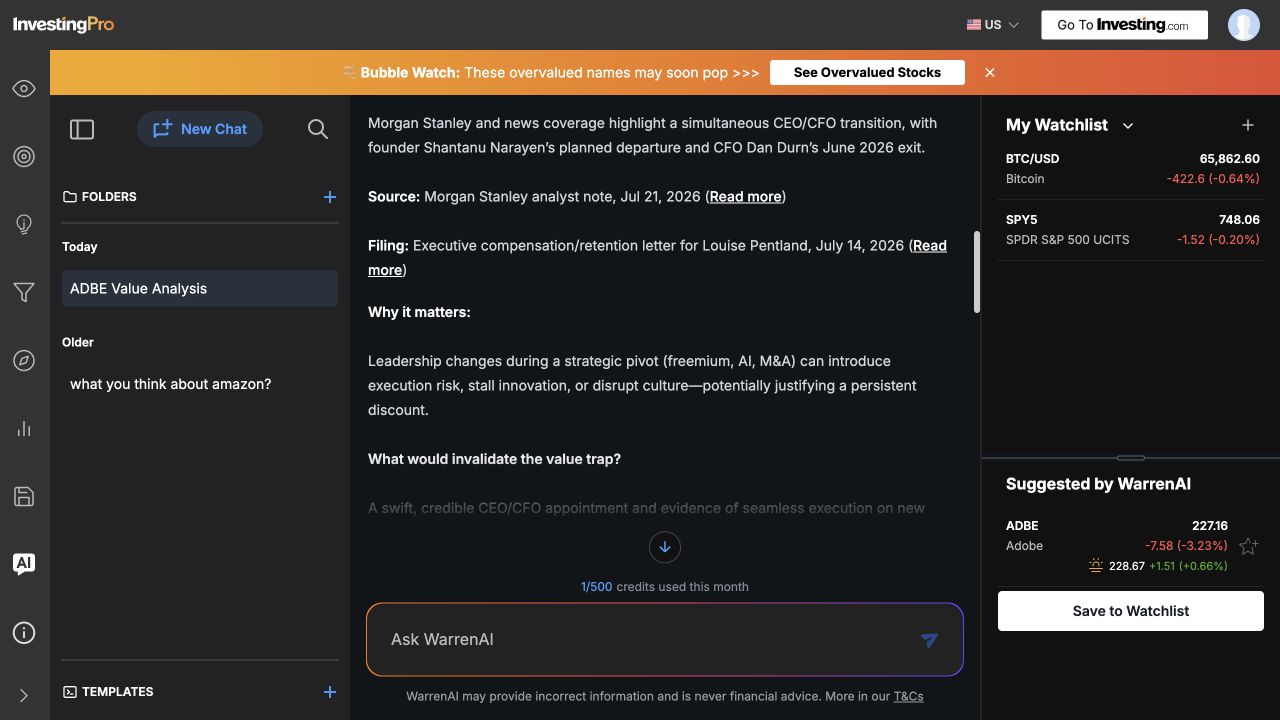
Open each source the response names, confirm the document exists, check the label and date against the company's own record, and verify the claim against the text. Anything resting on secondary commentary or an old document stays unverified until you have done that work, and sensitive personal or account information never goes into the prompt.
Step 5. Verify the latest filing and decide
Finish the workflow inside the company's own documents. Before you open the filing, compare the latest report date with the next scheduled earnings date shown on the company page. The first shows how fresh the inputs behind Fair Value and Financial Health are, the second shows how soon they will change, and an estimate taken just before results can be stale within a week.
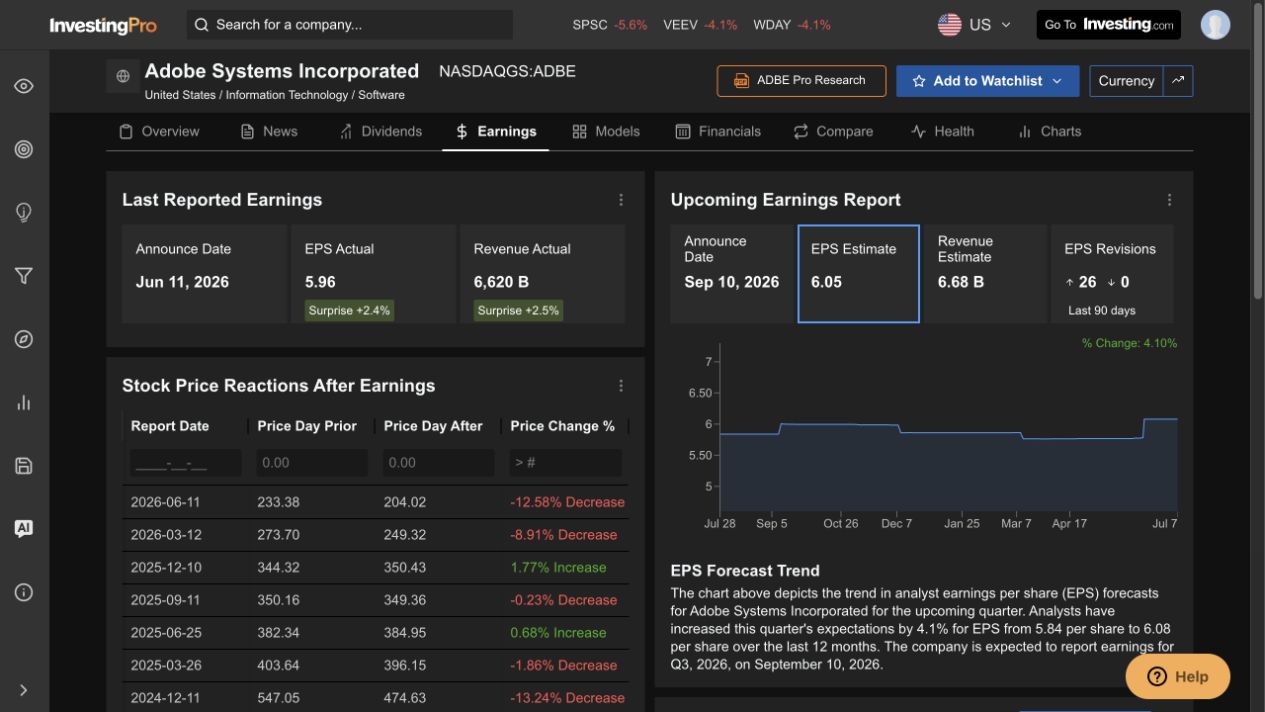
Read the filing or transcript for the assumptions most likely to explain the discount. Check whether free cash flow comes from durable operations or one-off swings, how debt is trending, whether margins are holding, whether share count is creeping up through dilution, whether industry change justifies a lower multiple, and whether management's guidance supports the growth the valuation models assume. This pass is narrower than our broader pre-buy stock research checklist, which a surviving candidate still has to clear before any purchase.
Close every candidate with one of three written outcomes:
- Continue researching, because the filing raised questions more work can answer.
- Watchlist, because the case is plausible but you want a better price or the next earnings print first.
- Reject, because the discount turned out to be deserved.
Write the outcome down with the figures and the date attached, so you can audit the decision later.
Our verdict on using InvestingPro for undervalued stocks
We recommend InvestingPro for this workflow. Its strength is compression: screener, Fair Value, Financial Health, and WarrenAI sit in one place, so a candidate can move from screen result to written decision in a single session, and the geography filters extend the process beyond the American market, which is where we place the platform in a research stack, as the global and non-US complement. For the full assessment, read our full InvestingPro review; for plans and costs, see current InvestingPro pricing and discount.
The workflow suits self-directed investors who will inspect the assumptions behind a headline valuation and finish a session inside a filing. Skip it if you want a one-click recommendation or a guaranteed return; no tool delivers either, and drop any that promises them. To weigh the platform against alternatives, our guide to the best stock analysis tools covers the field.
Frequently asked questions
How do I find undervalued stocks without relying on a low P/E ratio?
Screen on more than one signal at once. Pair a model-based measure such as Fair Value upside with a minimum market capitalisation and a quality filter such as Financial Health, because a low P/E on its own often flags cyclical peaks, shrinking industries, or accounting distortions. Whatever surfaces the candidate, you still have to validate the discount against cash flow, debt, and the latest filing.
What is the difference between an undervalued stock and a value trap?
An undervalued stock trades below a defensible estimate of its worth for reasons that look temporary, so there is a plausible route to the gap closing. A value trap trades at a discount the business deserves, because cash flow is weakening, debt or dilution is rising, or the industry is shrinking, and it can keep getting cheaper. A screener cannot separate the two, which is why the checks in this guide focus on the drivers behind the discount.
How reliable is InvestingPro Fair Value, and why can it change?
Fair Value is a model output built from a pool of 17 approaches, with only the relevant ones applied to each company, and it moves whenever prices, financials, or estimates update. Treat it as a range with an uncertainty rating rather than a precise target, and check the applicable model count, because some businesses fit standard models poorly; banks, REITs, and recently listed companies all need different treatment. The figure is only as good as its model fit and data freshness.
Which metrics should I check after an undervalued-stock screener result?
Start with the quality of free cash flow, then debt, margin trends, share count and dilution, whether the industry itself explains the low valuation, and whether recent guidance supports the growth the valuation assumes. Inside InvestingPro, the Financial Health components and the dated financials view cover most of that ground in minutes.
Can WarrenAI replace reading company filings?
No. WarrenAI is a beta research assistant, and Investing.com warns its output may contain errors or be incomplete or out of date. It can structure an opposing case and surface possible sources to inspect, and that is real value, but deciding which filings and transcripts are relevant, and verifying every source and claim, stays with you.
Conclusion
Save the five steps as a checklist and run every candidate through them in order: screen with quality filters, read Fair Value as a range, open the Financial Health components, make WarrenAI argue the other side, and confirm the story in the latest filing. Then record why each name moved forward, joined the watchlist, or failed, with the figures at the time. Those notes give you an honest account of how the process performs and where it needs tightening.
Kai is an investor who helps people choose the right broker and invest with confidence. He founded MatchMyBroker, a broker-comparison site for a global audience, and EU Investing Hub, his European-focused investing site. He also runs the Smart Money with Kai YouTube channel, where he breaks down investing, brokers and personal finance.
InvestingPro is an affiliate partner. We may earn a commission if you subscribe through our links, at no extra cost to you.