Seeking Alpha Quant Growth & Income Review 2026: How QGI Works


Last updated: 7 Sep 2026
Seeking Alpha's Quant Growth & Income portfolio, usually shortened to QGI, is the middle option in the company's portfolio lineup. It gives you more structure and a clearer dividend mandate than Alpha Picks, while demanding far less trading and maintenance than the PRO Quant Portfolio. I rate it 4.9 out of 5, a score that reflects the product structure, usability, transparency, and fit within the Seeking Alpha lineup. What the score cannot reflect is long-term performance, because the live portfolio only started on 3 June 2026 and remains far too young for a full-cycle judgment.
For this review I worked inside the authenticated QGI dashboard, the webinar archive, and Seeking Alpha's official documentation, and I compared the product directly against Alpha Picks and the PRO Quant Portfolio.
What Seeking Alpha Quant Growth & Income is
QGI is a rules-based model portfolio published by Seeking Alpha. It is not a fund, an ETF, a managed account, a brokerage account, or a personalized advisory service. Seeking Alpha publishes the model, and subscribers decide whether to replicate it by placing trades through their own brokerage accounts.
The portfolio holds up to 30 dividend-paying securities. Eligible names can include US stocks, US-listed ADRs, REITs, and smaller companies, as long as they pay a dividend and have averaged a market capitalization of at least $400 million over the prior month.
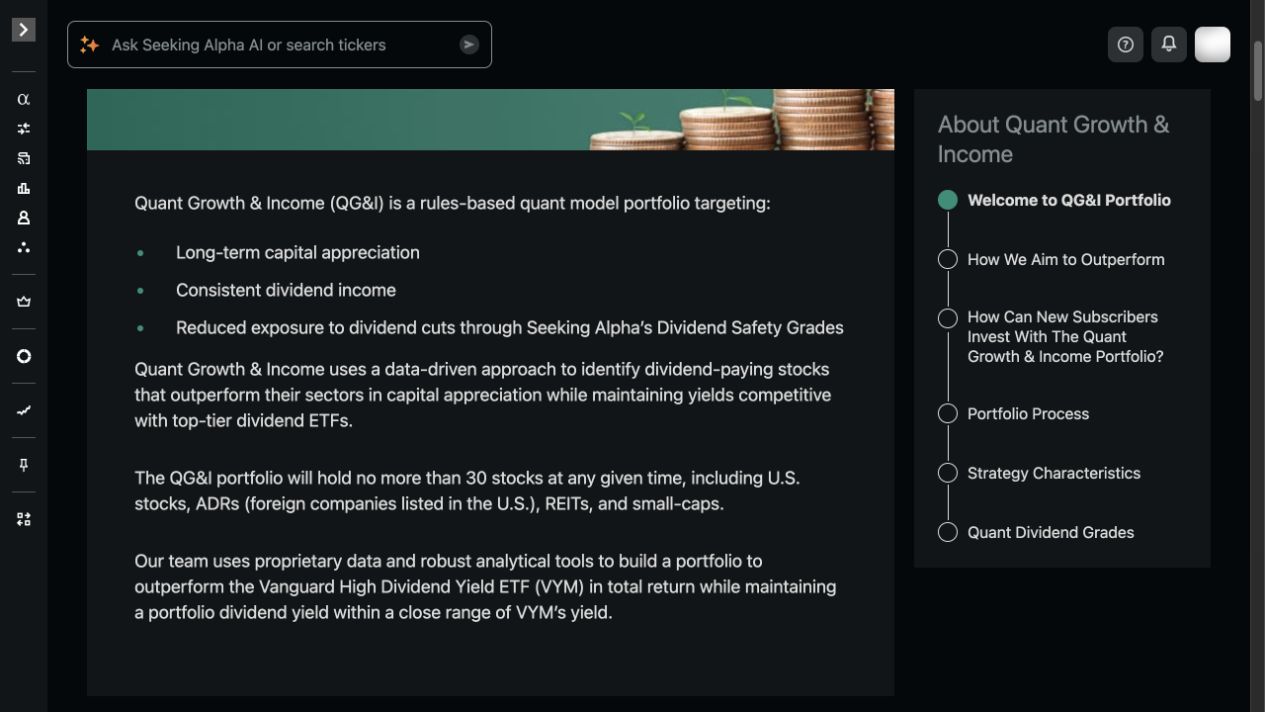
The objective is long-term capital appreciation plus consistent dividend income, with lower exposure to dividend cuts through Seeking Alpha's Dividend Safety Grades. Those grades reduce risk. They do not eliminate the possibility of a cut.
The benchmark is the Vanguard High Dividend Yield ETF, ticker VYM. That choice tells you how Seeking Alpha positions the product: it wants QGI judged against a mainstream dividend index fund rather than a growth index.
How QGI selects and removes stocks
Entry is filter-driven. A stock needs a Buy or Strong Buy Quant Rating, and Seeking Alpha requires that rating to hold for a consecutive period before the stock qualifies. The exact length of that period is not disclosed, which is one of the few transparency gaps in the documentation.
On top of the Quant Rating, QGI layers three dividend-specific filters: Dividend Growth, Dividend Safety, and Dividend Yield grades. This combination is what separates QGI from Seeking Alpha's other portfolios. A stock cannot enter on quant strength alone. It also has to look healthy as a dividend payer.
Changes follow a fixed schedule. Trade updates and the accompanying analysis are published every two weeks on Wednesdays at 1:00 p.m. Eastern Time. The strategy averages about two stock changes per cycle, although actual turnover can vary with what the quant system flags.
That cadence matters in practice. Two changes every two weeks is a workload most part-time investors can sustain, and it is noticeably calmer than the weekly rhythm of the PRO Quant Portfolio.
How using the portfolio works in practice
Because QGI is a model rather than a product you buy into, the workflow is manual by design:
- Subscribe and open the current portfolio of up to 30 holdings.
- Replicate the positions in your own brokerage account at whatever scale fits your capital.
- Read the scheduled update every second Wednesday, including the reasoning behind each change.
- Place the roughly two resulting trades yourself, then repeat the cycle.
There is no autopilot layer here. QGI tells you what the model holds and why it changed. Everything else, from position sizing to order types, is your call. That is a feature for investors who want control and a chore for anyone hoping for automation.
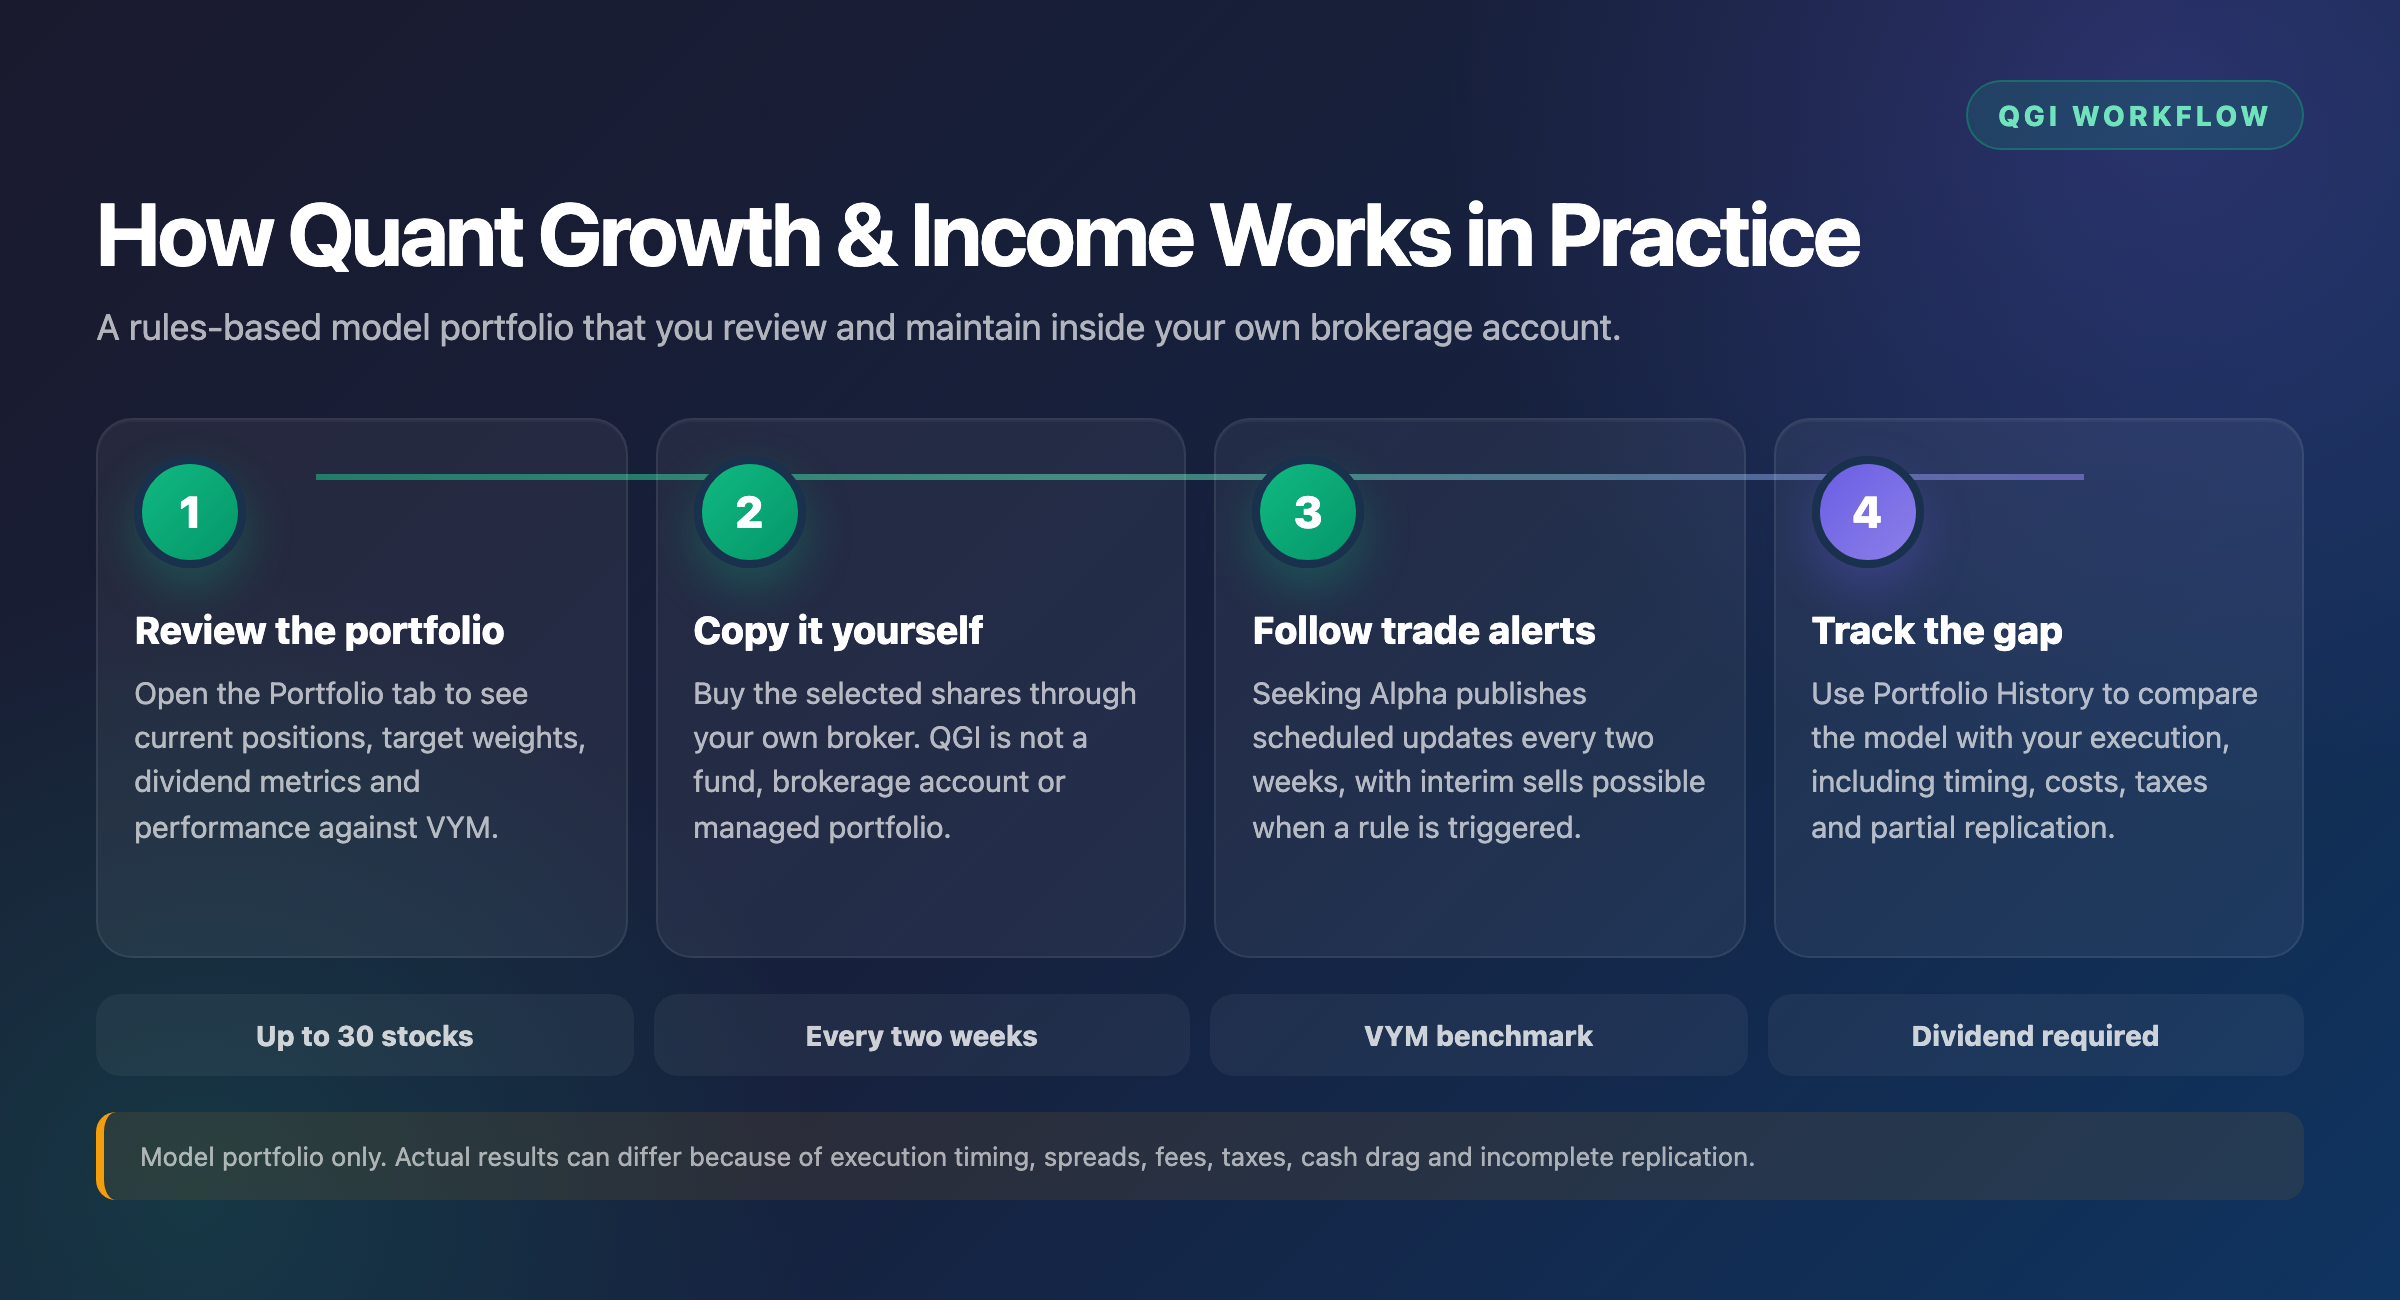
Your broker matters too, because commissions, currency fees, and fractional share support all affect how closely you can track the model. So does your own discipline. The model assumes its trades happen on the published dates, while your execution happens whenever you get to it.
What subscribers receive
The subscriber area is organized into five sections: Portfolio, Analysis, Portfolio History, Webinars, and About.
Portfolio shows the current holdings and the dashboard metrics. Analysis collects the written updates behind each trade cycle. Portfolio History logs past changes, which helps later joiners understand how the model reached its current shape.
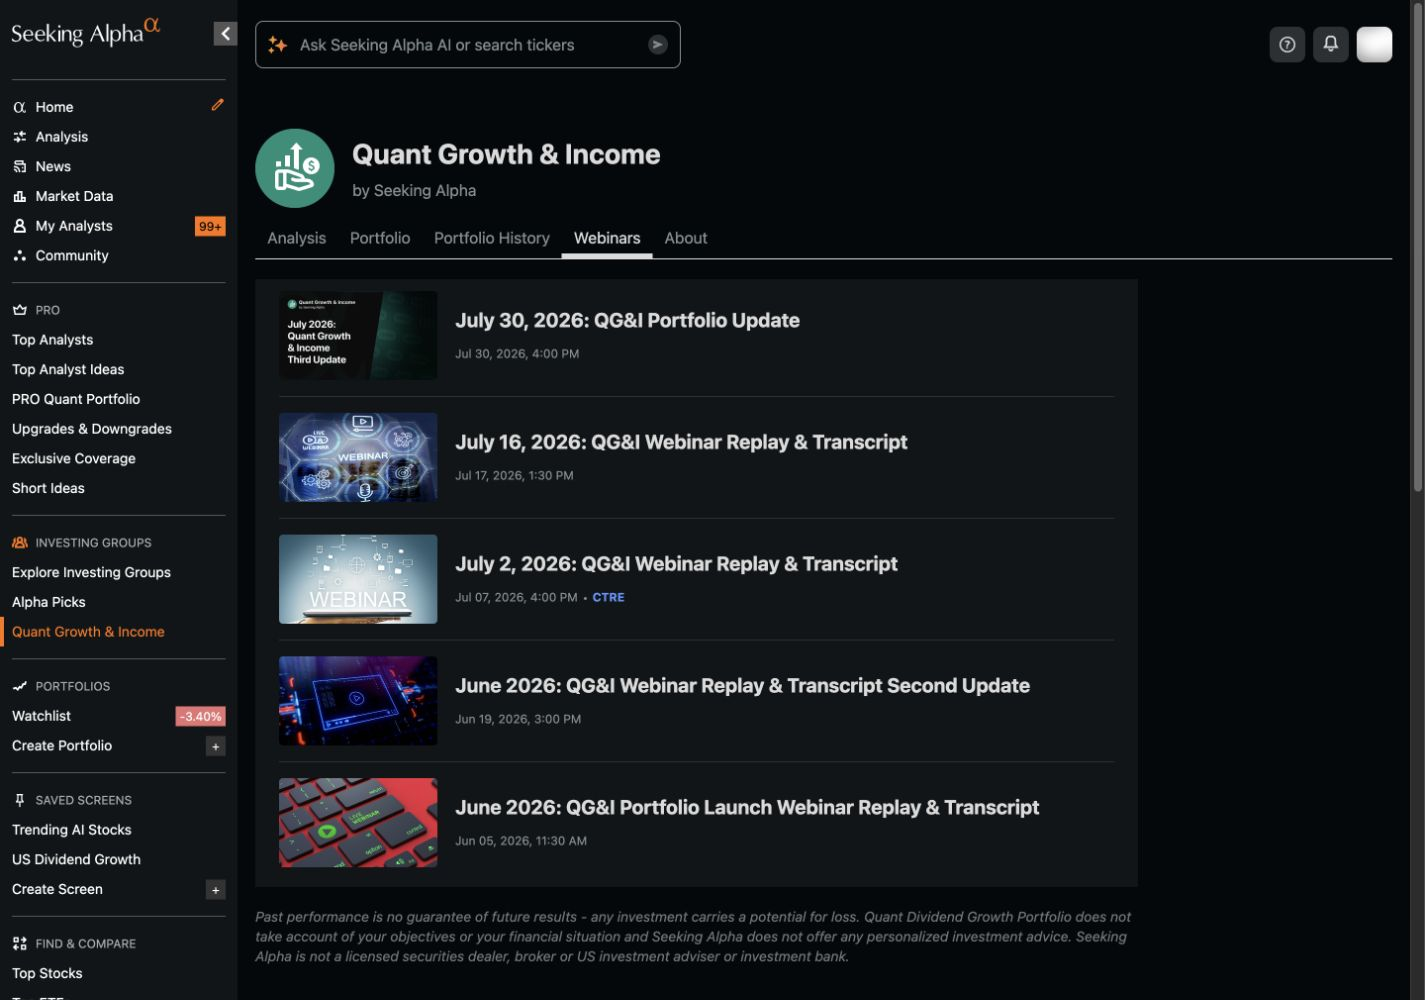
The Webinars area includes the scheduled portfolio update sessions plus replays and full transcripts. If you miss a session, the transcript is the fastest way to see what changed and why. The About page documents the methodology, including exactly how performance is calculated, and it is worth reading before you look at any return figure.
Early live results as of 3 September 2026
QGI's live history began on 3 June 2026, so the track record was only about three months old at the latest dashboard observation. Read this section as a dated snapshot, nothing more.
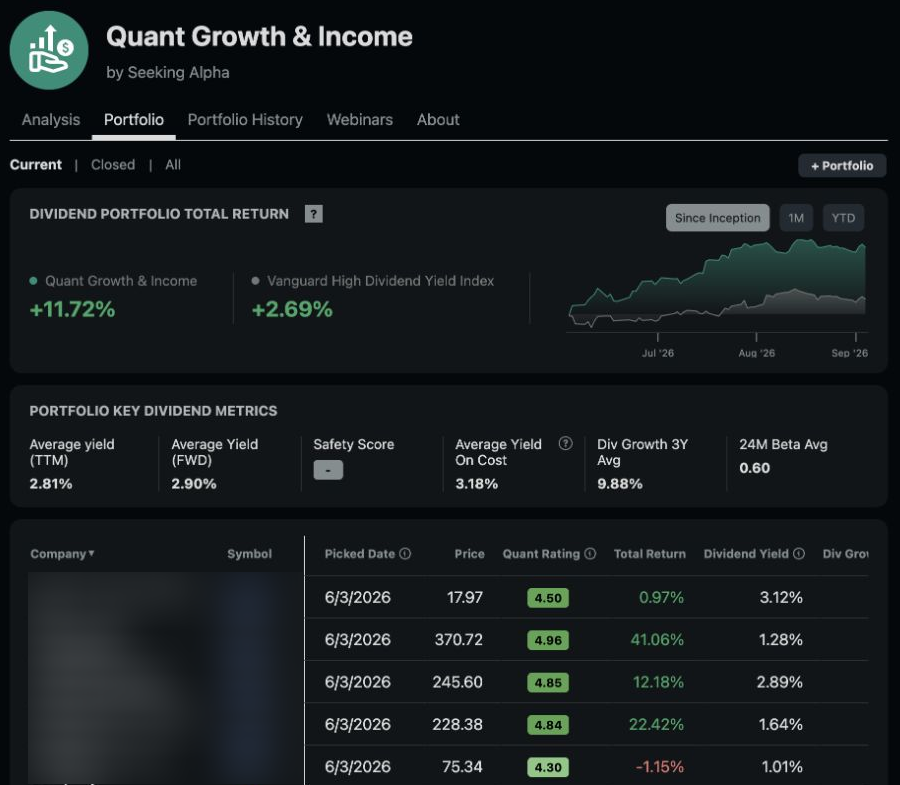
As of 3 September 2026, the dashboard showed a total return of 11.72% since inception, against 2.69% for the Vanguard High Dividend Yield Index over the displayed period. Past performance is not indicative of future results. I will not annualize a record this short, and no three-month stretch tells you how a strategy behaves across a full cycle.
The dividend metrics say more about the portfolio's character. The current dashboard shows an average trailing yield of 2.81%, an average forward yield of 2.90%, an average yield on cost of 3.18%, a three-year average dividend growth rate of 9.88%, and an average 24-month beta of 0.60. The Safety Score is unavailable, with the dashboard showing "Rating Not Covered". Together those numbers describe a moderate-yield portfolio built around dividend growth and safety rather than maximum income, with lower measured volatility than the broad market over the trailing two years.
Two structural caveats apply. Seeking Alpha states that the model is not real money and is not an audited GIPS-compliant investment product. Model performance uses notional volume-weighted average prices on trade dates, reinvested dividends, and time-weighted returns. Your results can differ because of execution timing, spreads, fees, taxes, cash drag, how your broker handles dividends, and incomplete replication if you skip positions.
QGI vs Alpha Picks vs PRO
Seeking Alpha now runs three portfolio products, and the differences become clear once you line them up.
Alpha Picks targets long-term capital appreciation against the S&P 500. There is no dividend requirement, and instead of a fixed model it delivers two new picks per month into a growing pick portfolio. It suits investors who want a simpler, lower-frequency idea flow rather than a complete model to maintain.
The PRO Quant Portfolio sits at the active end. It targets exposure to the top current Quant stocks against the S&P 500 Equal Weight index, normally holds 30 equal-weight positions, and updates weekly with typically two to three changes. That means more trading, more attention, and a higher subscription cost, so it fits more active investors with more capital and time.
QGI is the middle path: a fixed model of up to 30 stocks like PRO, but with a dividend mandate, a VYM benchmark, and a calmer two-week cadence. One early subscriber described QGI as an income and growth sleeve, Alpha Picks as a growth sleeve, and PRO as the option that needs more money and time. That is one person's framing rather than broad sentiment, but it matches how the products are built.
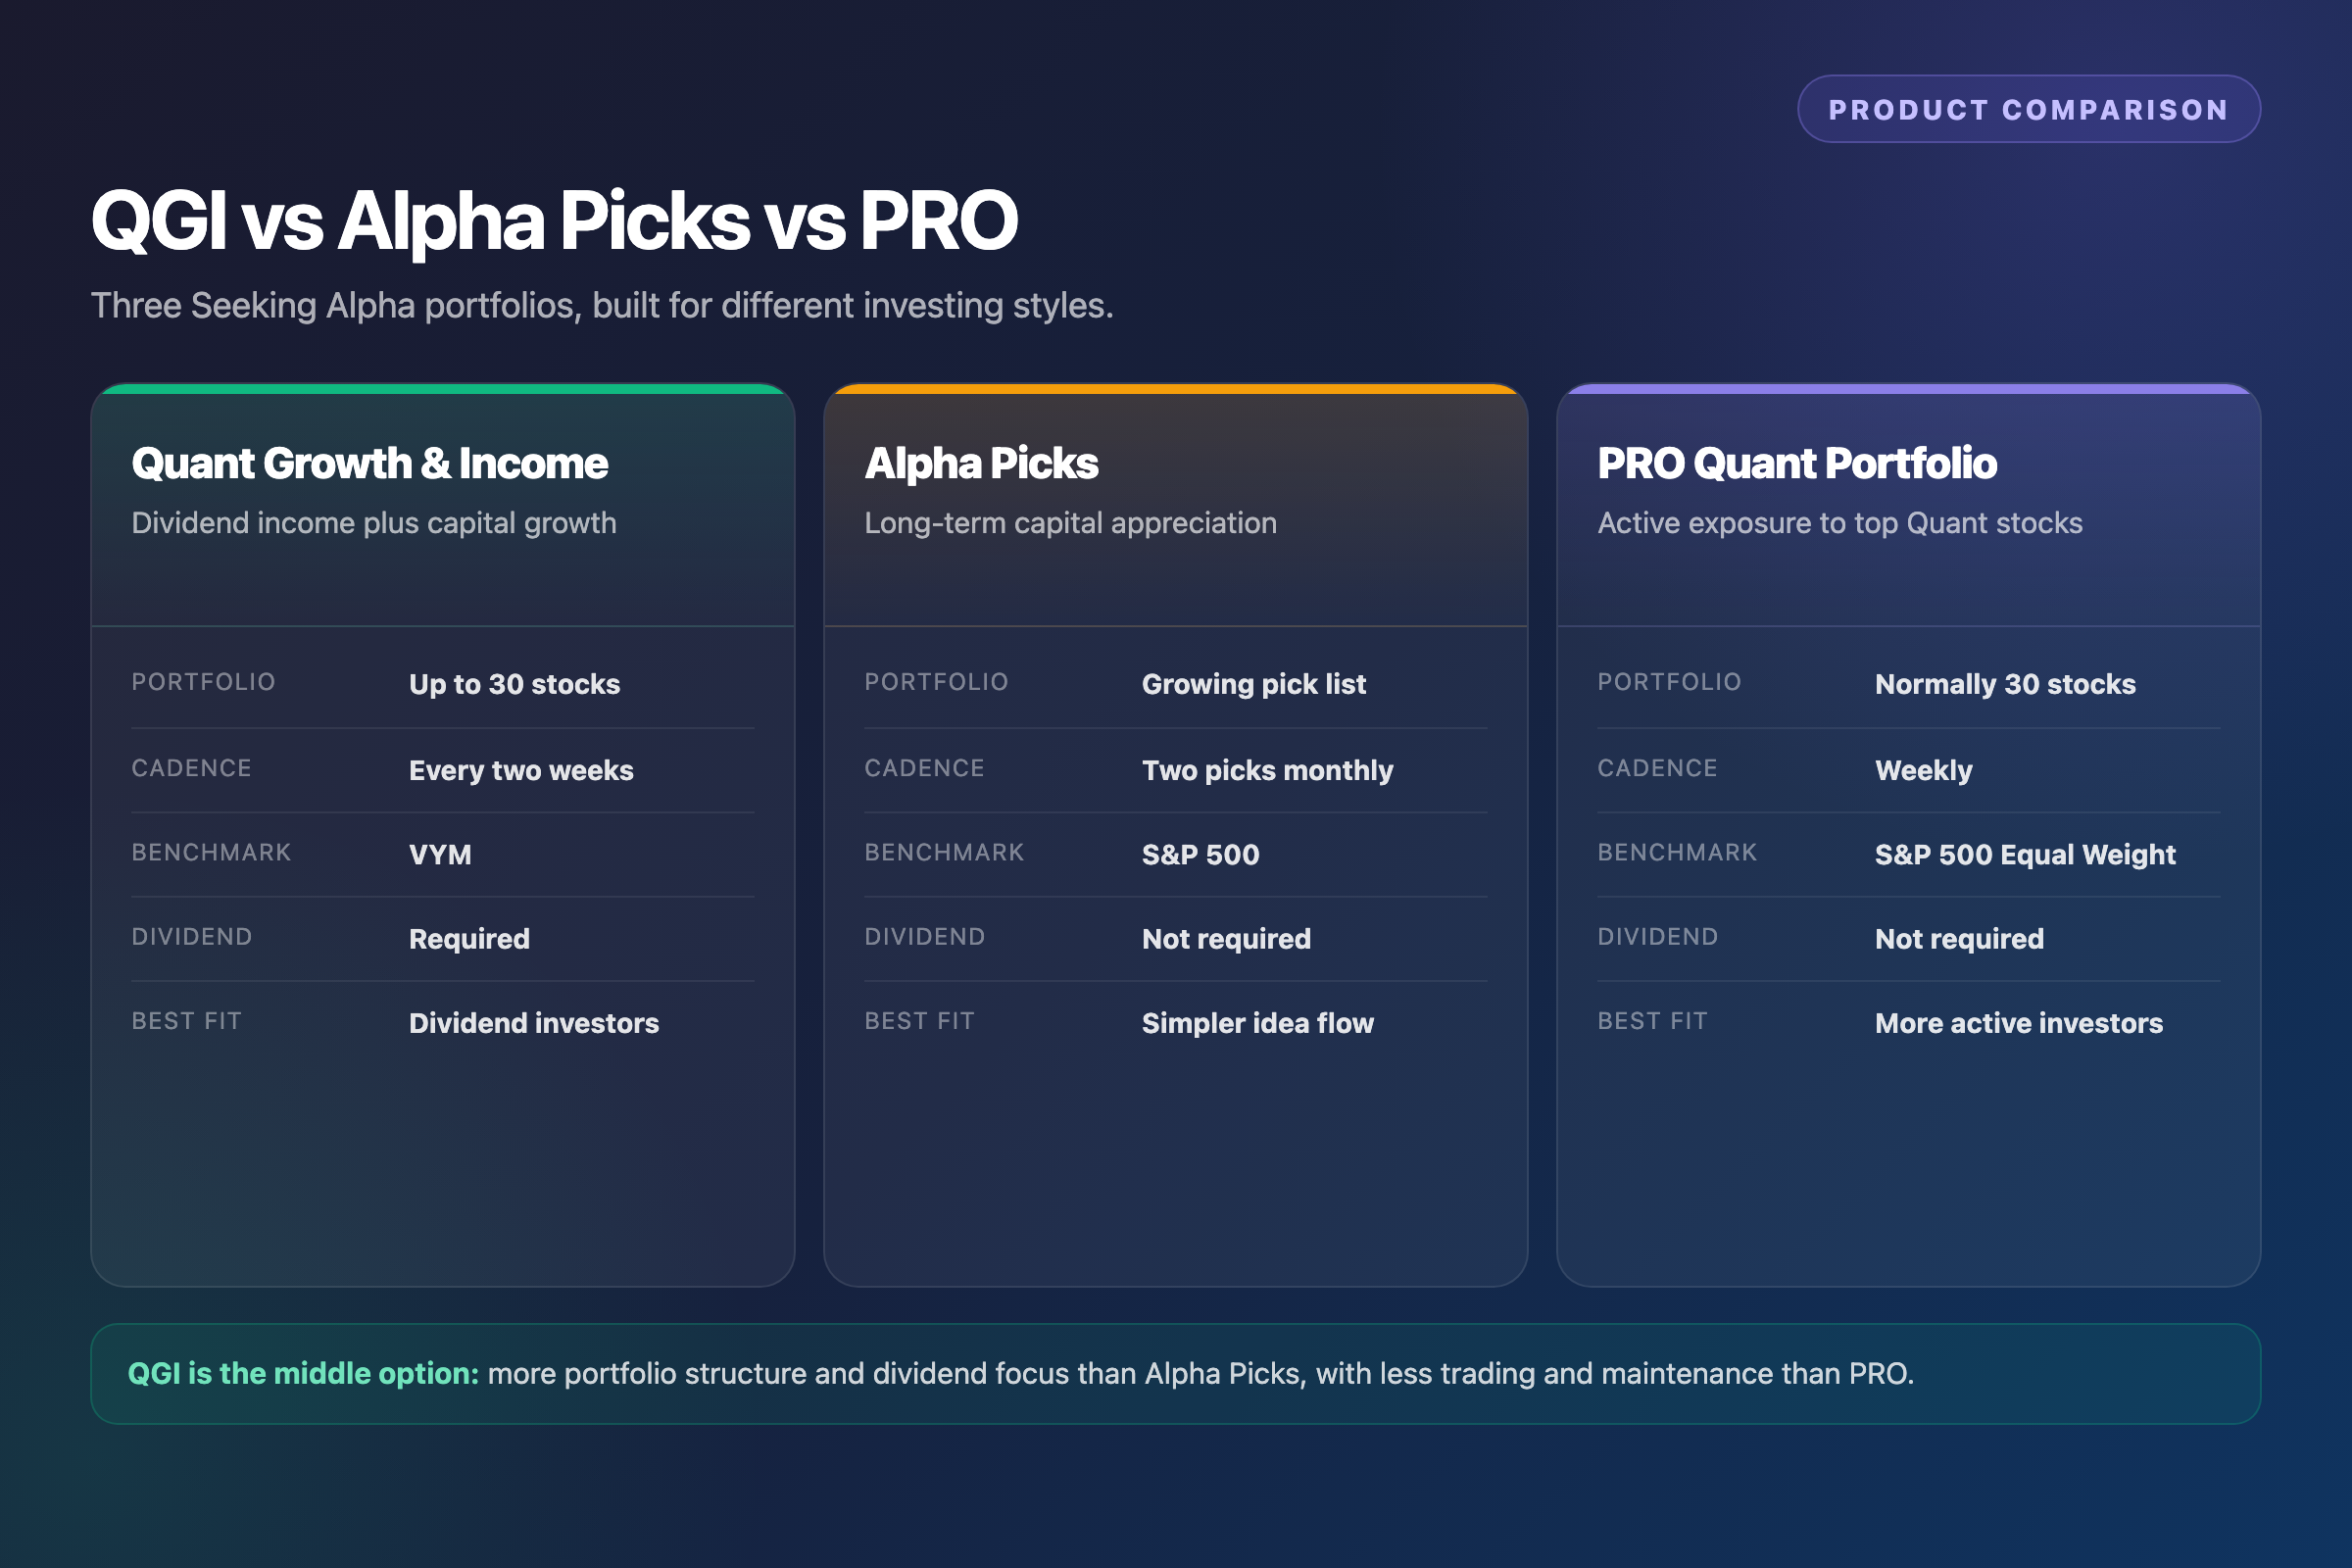
I will not rank the three by performance. Their benchmarks, launch dates, and performance methods differ, so any direct return comparison would mislead. For a structural overview of everything Seeking Alpha sells, see my comparison of Seeking Alpha subscriptions.
Is QGI worth $449 per year
Through the current affiliate offer, QGI costs $449 per year against a list price of $499. Renewal pricing has not been confirmed, so plan on the basis that year two could cost more. My Seeking Alpha discount guide tracks how pricing moves across the company's products.
Because the fee is flat, its weight depends on the capital following the model. At $449 per year, the subscription equals 0.90% of a $50,000 portfolio, 0.45% of a $100,000 portfolio, and 0.22% of a $200,000 portfolio. Those percentages exclude trading costs and taxes.
I will not prescribe a minimum portfolio size, because the right answer depends on your brokerage costs, your tax situation, and how fully you replicate the model. The logic is simple though: a fixed subscription becomes easier to justify as the replicated portfolio grows.
The price question also dominated the small amount of early community discussion. A pre-launch Reddit thread asked whether QGI was effectively an ETF and whether the price was justified. The honest answer is that QGI is not an ETF. You pay for the holdings, the reasoning, the webinars, and the flexibility to adapt the model, and in exchange you carry the work and costs of execution. Adjacent Alpha Picks and PRO discussions raise the same practical themes: subscription cost relative to portfolio size, incomplete replication, and the workload of following every change. Those are a handful of voices rather than a consensus, but they are the right questions to ask yourself before paying.
Who QGI is best for
QGI fits a specific type of investor:
- You want dividend income and capital growth from one portfolio rather than choosing between them.
- You are comfortable placing your own trades and checking in every two weeks.
- You prefer a rules-based process over discretionary stock picking.
- You have enough capital following the model that the flat fee stays a small percentage.
If you mainly want screeners, ratings, and research tools rather than a portfolio to copy, Seeking Alpha Premium is the better starting point. If you are still surveying the wider market, my guide to the best stock newsletters puts Seeking Alpha's products in a broader context.
Main drawbacks
- The live record only started on 3 June 2026, so there is no full-cycle evidence yet.
- Seeking Alpha does not disclose how long a stock must hold its qualifying Quant Rating before entry.
- Replicating the model yourself creates tracking differences through execution timing, fees, and taxes.
- Dividend Safety Grades lower the odds of dividend cuts but cannot remove them.
- Renewal pricing is unconfirmed, so the long-term cost is not yet knowable.
Final verdict
QGI earns its 4.9 rating on structure, not on history. The mandate is clear, the rules are mostly transparent, the two-week cadence is realistic for part-time investors, and the product fills an obvious gap between Alpha Picks and PRO. The score reflects product design, usability, transparency, and fit within the Seeking Alpha lineup. It is not a judgment on long-term returns, because with a 3 June 2026 start date no such judgment is possible yet.
If a rules-based dividend portfolio matches what you want, QGI is the Seeking Alpha product built for that job. If you need years of live evidence before paying for a model portfolio, watch the record build first and decide later.
Watch my full QGI video review
Frequently asked questions
Is QGI an ETF or managed portfolio?
Neither. QGI is a rules-based model portfolio. Seeking Alpha does not manage money, hold assets, or place trades for you. Subscribers review the model and execute every trade through their own brokerage accounts.
How many stocks does QGI hold?
Up to 30 dividend-paying securities. Eligible names can include US stocks, US-listed ADRs, REITs, and smaller companies with an average market capitalization of at least $400 million over the prior month.
How often does QGI change its portfolio?
Scheduled updates are published every two weeks on Wednesdays at 1:00 p.m. Eastern Time. The strategy averages about two stock changes per cycle, although actual turnover can vary.
Does QGI require a Seeking Alpha Premium subscription?
The materials reviewed for this article do not clearly establish whether QGI is sold strictly on its own or alongside other access. Confirm the exact access and checkout requirements on the current offer page before subscribing.
How is QGI different from Alpha Picks?
Alpha Picks targets capital appreciation against the S&P 500, has no dividend requirement, and adds two new picks per month to a growing pick portfolio. QGI is a fixed model of up to 30 dividend payers, benchmarked against VYM, with scheduled updates every two weeks.
How is QGI different from the PRO Quant Portfolio?
PRO normally holds 30 equal-weight positions with no dividend requirement, updates weekly with typically two to three changes, and is benchmarked against the S&P 500 Equal Weight index. It demands more time, more trading, and a higher subscription cost. QGI moves at half the pace and requires every holding to pay a dividend.
Can subscriber returns differ from the dashboard?
Yes. The dashboard tracks a notional model using volume-weighted average prices on trade dates, reinvested dividends, and time-weighted returns, and Seeking Alpha states the model is not real money. Execution timing, spreads, fees, taxes, cash drag, dividend handling, and partial replication all create differences in practice.
Kai is an investor who helps people choose the right broker and invest with confidence. He founded MatchMyBroker, a broker-comparison site for a global audience, and EU Investing Hub, his European-focused investing site. He also runs the Smart Money with Kai YouTube channel, where he breaks down investing, brokers and personal finance.
Quant Growth & Income is a model portfolio, not a fund, managed account, brokerage account, or personalized advisory service. Subscriber results may differ from the notional dashboard because of execution timing, spreads, fees, taxes, cash drag, dividend handling, and partial replication.