Simply Wall St Review (2026): Is It Worth It?


Most stock research tools bury you in numbers. Simply Wall St does the opposite: it turns a company’s fundamentals into a single coloured visual you can read in about ten seconds. That one design choice is why more than seven million investors use it, and also why seasoned analysts often grow out of it.
We spent time across its stock reports, screeners and portfolio tools to work out who Simply Wall St is built for, what it costs once the introductory discount ends, and where it comes up short. The short version: it is one of the best visual, beginner-friendly ways to understand a stock and track a whole portfolio, as long as you know going in that it hands you the analysis and lets you make the call, rather than telling you what to buy.
What Simply Wall St actually is
Simply Wall St is a visual stock-analysis and portfolio-tracking platform, not a broker. You don’t buy shares through it. Its financial data is licensed from S&P Global, and it layers its own analysis model on top to score every listed company in the world.
The signature is the “Snowflake,” a five-point graphic that distils a company into five areas: Value, Future (growth), Past (performance), Health (balance sheet) and Dividend. The more filled and green each arm, the stronger the company on that measure. You can size up a business at a glance before deciding whether it is worth a deeper look.
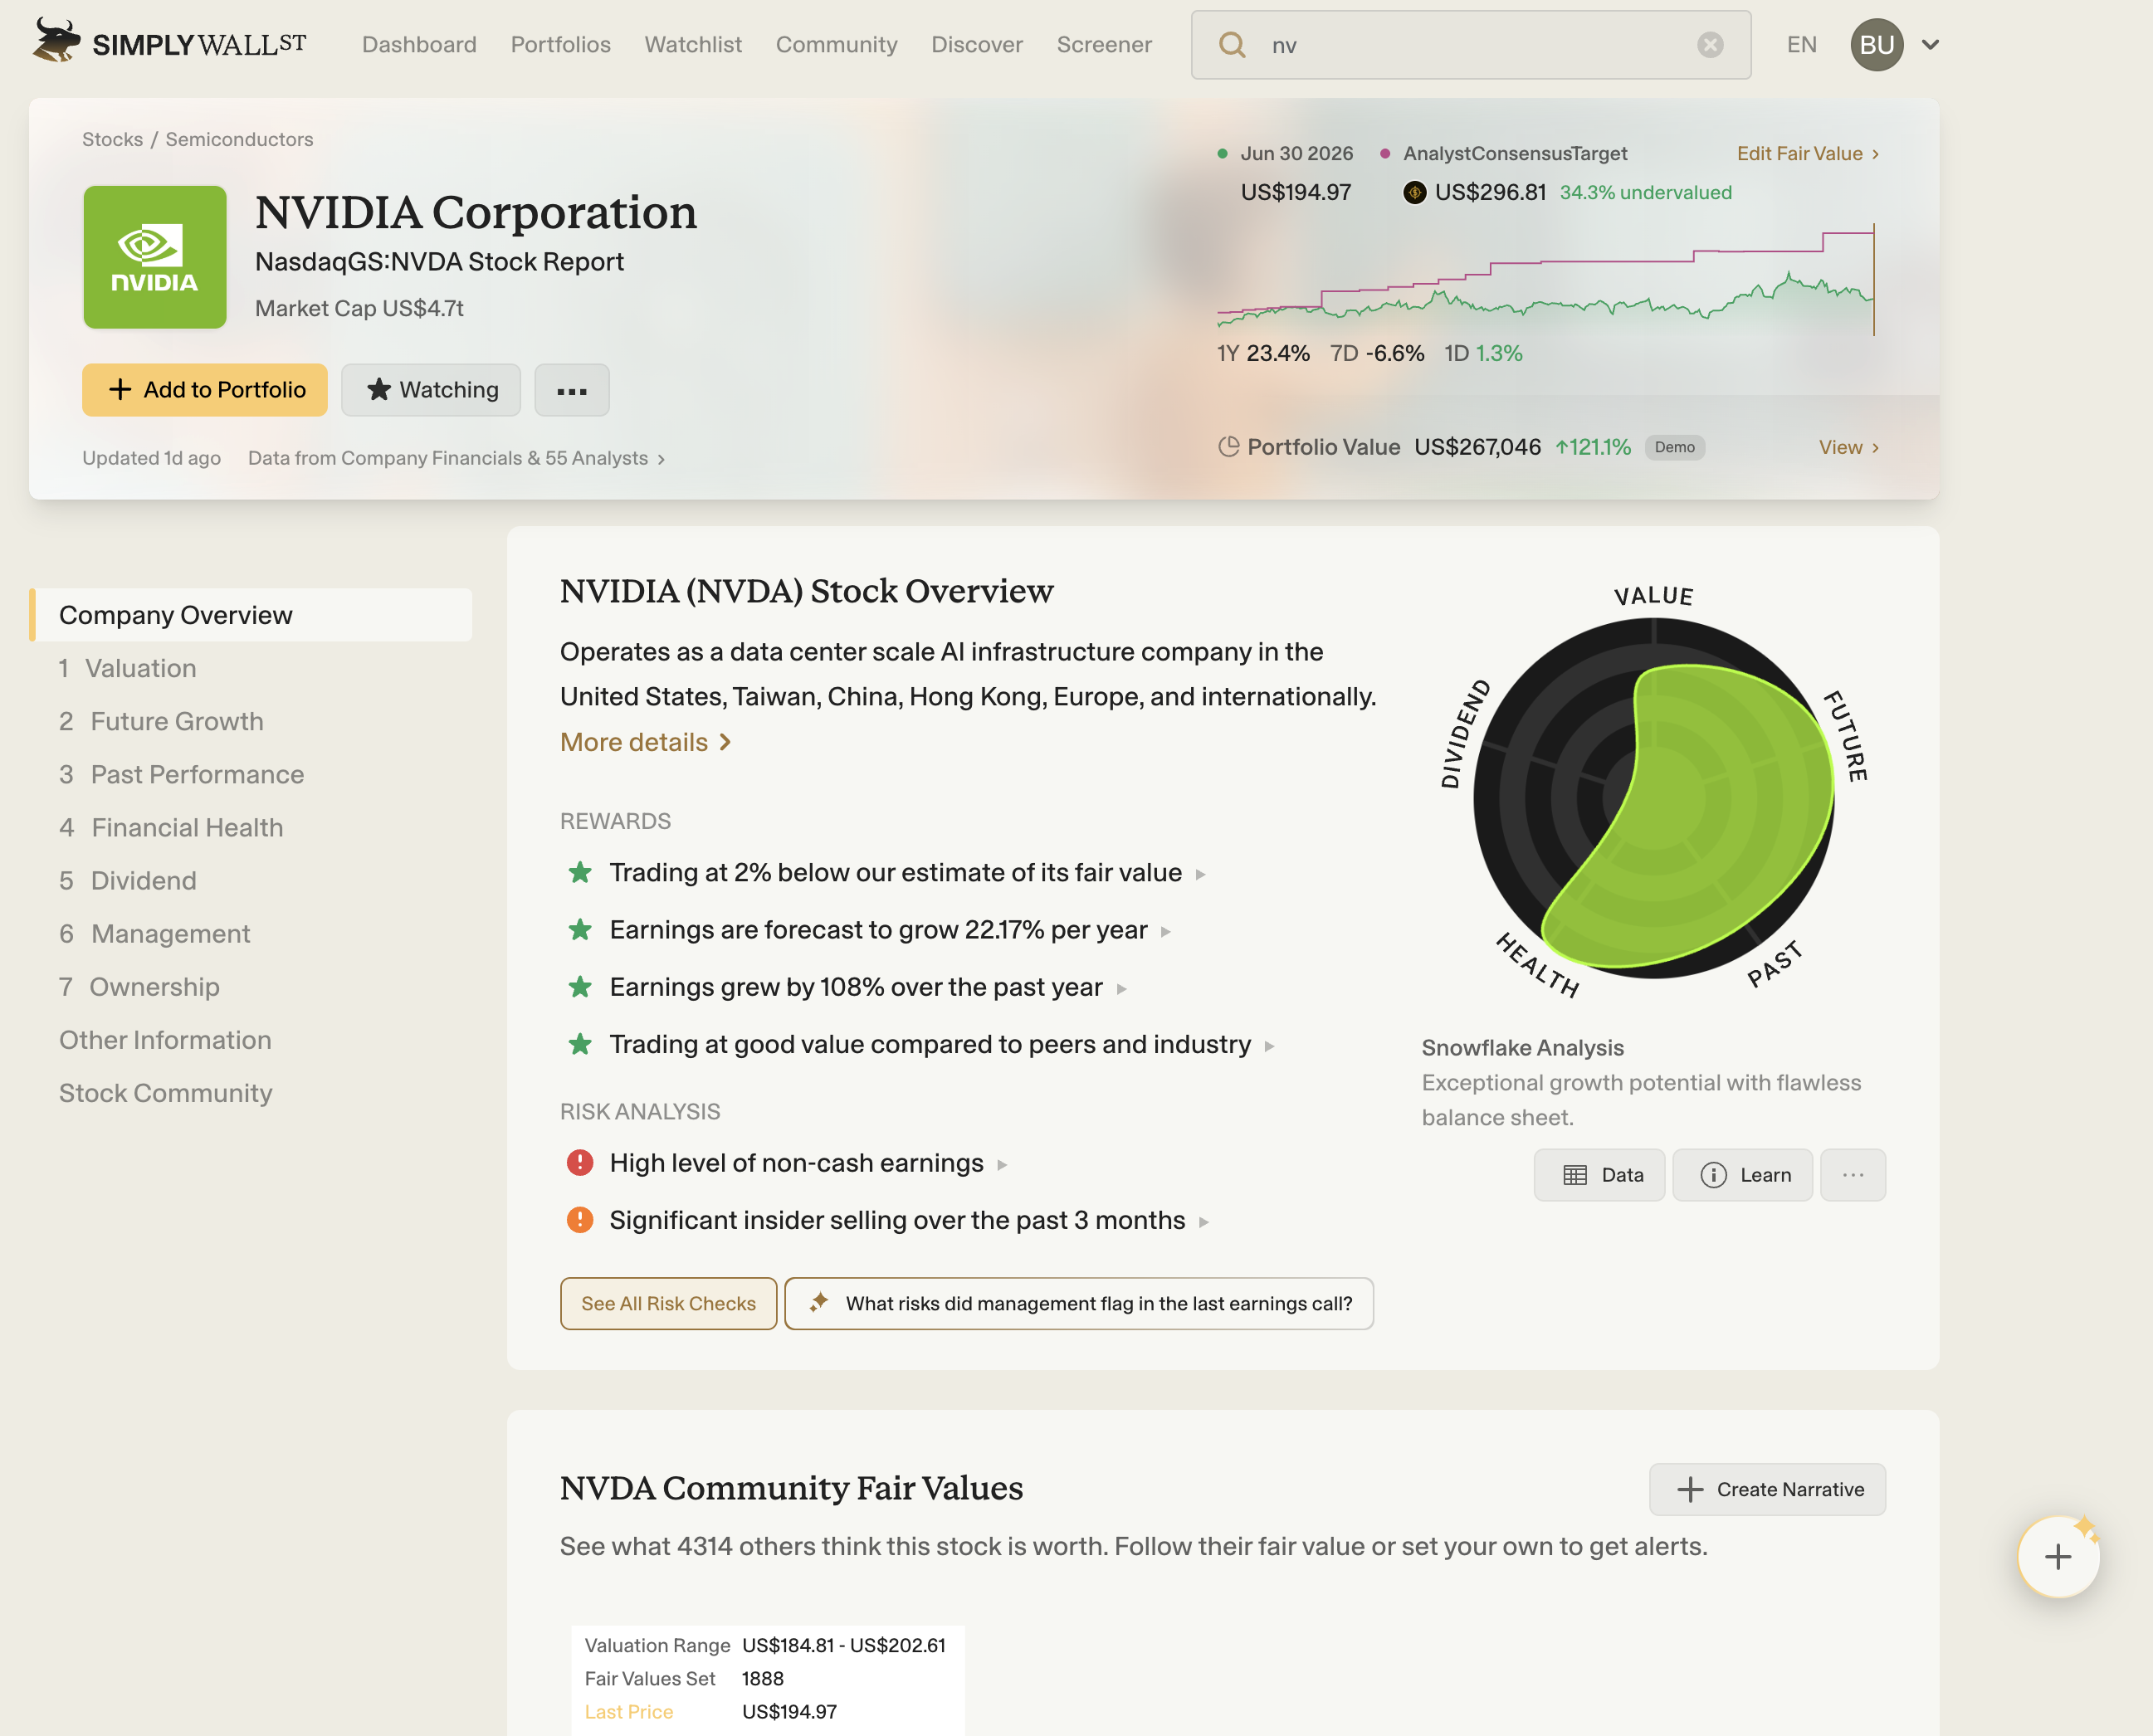
Behind that visual sits a useful one-page report on every stock: a plain-language breakdown of rewards and risks, a Fair Value estimate, growth forecasts from analyst consensus, financial-health checks, dividend quality and insider activity. There is also “Narratives” for writing and tracking your own investment thesis (or following the community’s), plus screeners and alerts.
The format is what makes it click. The entire analysis of a stock sits on one long, scrollable page: type in a ticker and you read it top to bottom like a visual essay, valuation, growth, financial health, dividends and risks, each section in order. Most research tools scatter that across tabs you click through, which gets overwhelming fast. Here you just scroll, and by the end you have the full picture. For anyone who has never analysed a stock before, it is the gentlest on-ramp we have come across.
Who it is for, and what it is great at
Beginners and visual learners. This is the strongest case for Simply Wall St. It explains what each metric means in normal language and strips out the intimidation of raw filings. If you have ever opened an annual report and closed it again, this is the on-ramp.
Investors who want global coverage. Simply Wall St covers around 120,000 stocks across 90 markets, from the US to the UK, Europe, Australia, India, Canada and Japan. There is no second-class treatment for non-US stocks, a real edge over US-centric research tools. We checked a few German names ourselves and they came up with full reports, not just US tickers, which backs up the global coverage.
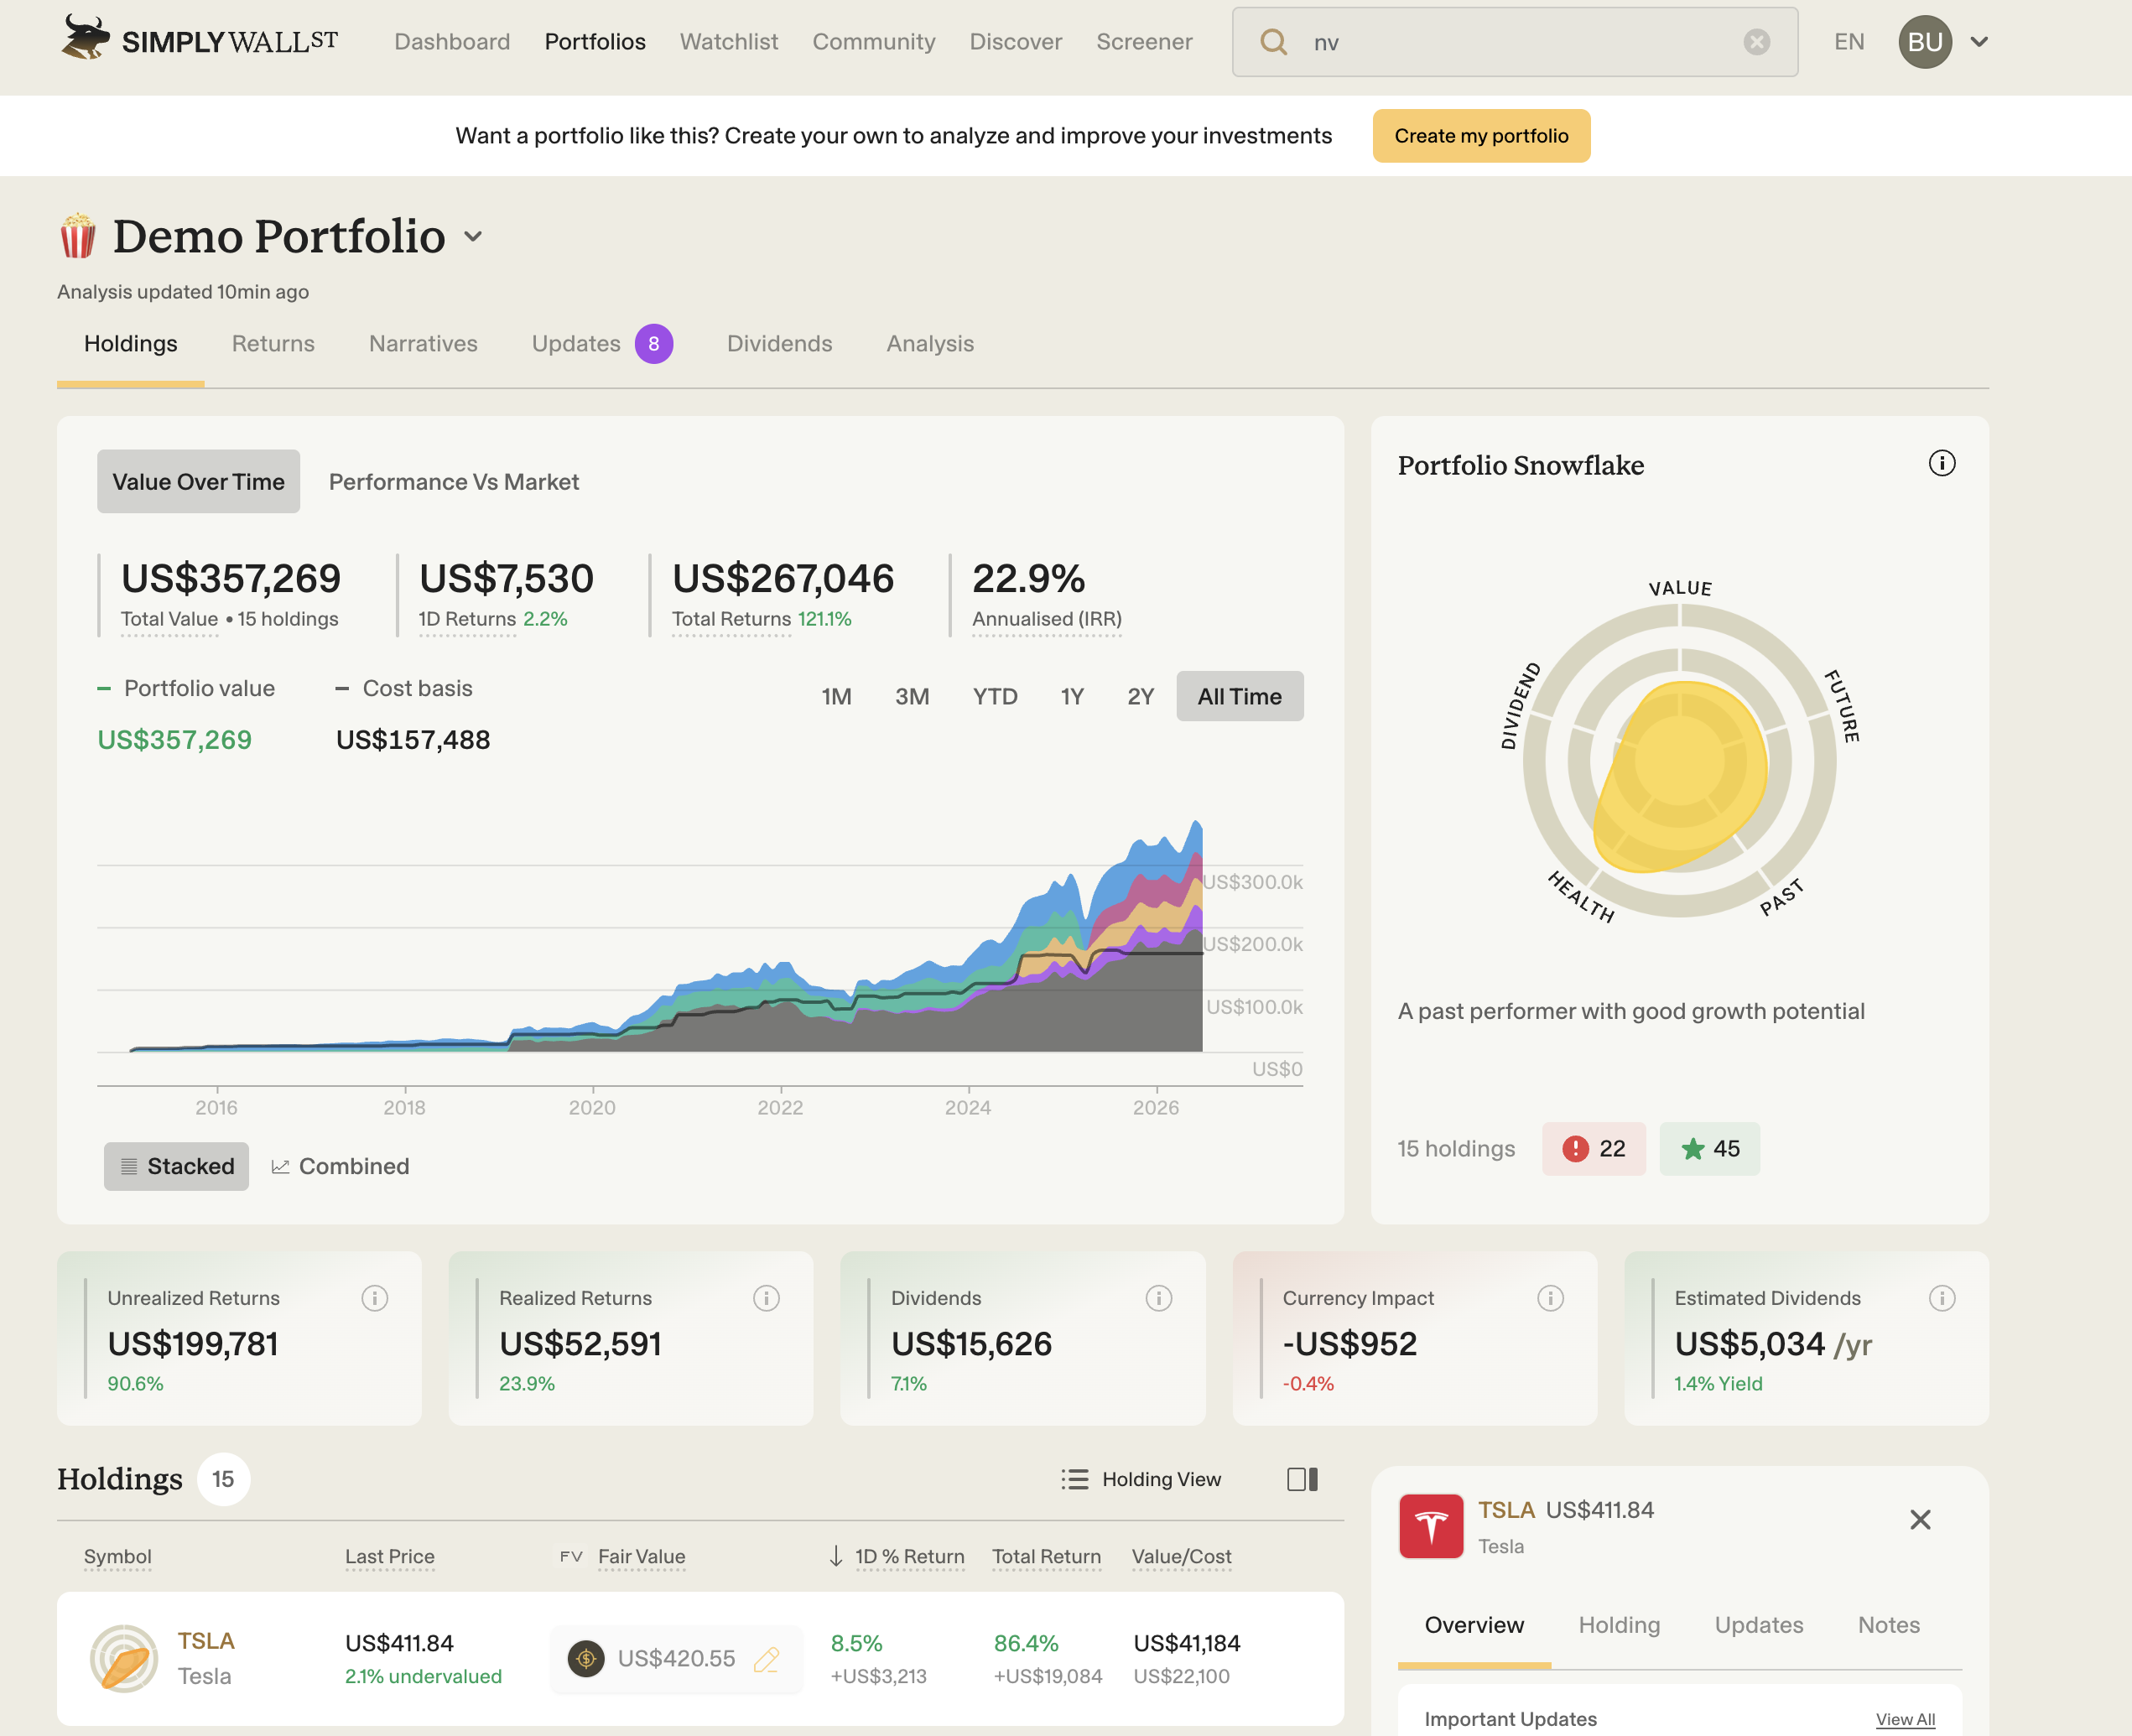
Anyone who wants their whole portfolio in one view. You can import holdings from 2,000-plus brokers or a spreadsheet, and Simply Wall St shows your true return, including dividends, currency effects and an annualised figure, plus a portfolio-level Snowflake so you can see the health and concentration of everything you own at once. For many people this alone replaces a messy tracking spreadsheet.
It screens well, too. The visual Snowflake screener lets you drag criteria to filter the global market, and ready-made themes (undervalued, dividend payers, insider buying) help spark ideas.

The one thing to understand: it does not pick stocks for you
Be clear on this before you sign up. Simply Wall St is a research tool, not a tip sheet. It says so itself: the platform “does not make stock recommendations such as Buy or Sell,” and as its own comparison page puts it, it “doesn’t tell you ‘buy this stock’, it shows you the company’s financial reality and lets you decide.” It surfaces discovery themes to help you find ideas, but there is no tracked model portfolio and no published buy/sell record.
There is nothing wrong with that. It just means Simply Wall St solves a different problem than a picks service does, and that changes who should buy it. If what you actually want is a curated, done-for-you list of stocks with a track record, two of its rivals do exactly that:
- Seeking Alpha’s Alpha Picks gives you two data-driven picks a month with sell alerts and a public track record. See our Alpha Picks review.
- InvestingPro’s ProPicks AI offers AI-built stock-pick strategies across US and international markets. See our InvestingPro review.
Use Simply Wall St to understand and screen companies yourself, visually. Use one of those if you would rather be handed the shortlist. Plenty of investors run both.
Where Simply Wall St falls short
The Fair Value is a starting point, not gospel. On most plans the assumptions behind the intrinsic-value estimate (growth and discount rates) are set automatically and you can’t adjust them. Treat the Fair Value as one informed opinion and the scoring as a templated first pass, not a bespoke model. Experienced value investors are the ones most likely to find this limiting.
It is built for the long term, not the trading screen. Prices are end-of-day rather than real-time, the historical data is not as deep as specialist platforms, and coverage is equities-only (no funds or bonds). None of that matters for a buy-and-hold investor; all of it matters if you want to go deep.
Mind the renewal. The introductory discount applies to your first year only, after which the subscription renews at the standard price, and reviewers regularly flag that renewals arrive with little warning and that cancelling can be fiddly. Set a calendar reminder so year two is not a surprise.
Pricing and the reader offer
Simply Wall St has three tiers, billed annually, in USD:
- Free, $0. Five company reports a month, one portfolio capped at ten holdings, one watchlist. Enough to test, too limited for real use.
- Premium, $131.40/yr ($10.95/mo). Thirty reports a month, three portfolios of up to thirty holdings, three screeners with alerts, and Excel/PDF export. The plan most people want.
- Unlimited, $258/yr ($21.50/mo). Unlimited reports, five portfolios with unlimited holdings, ten screeners. For power users tracking a lot of positions.
Every paid plan comes with a 14-day money-back guarantee.
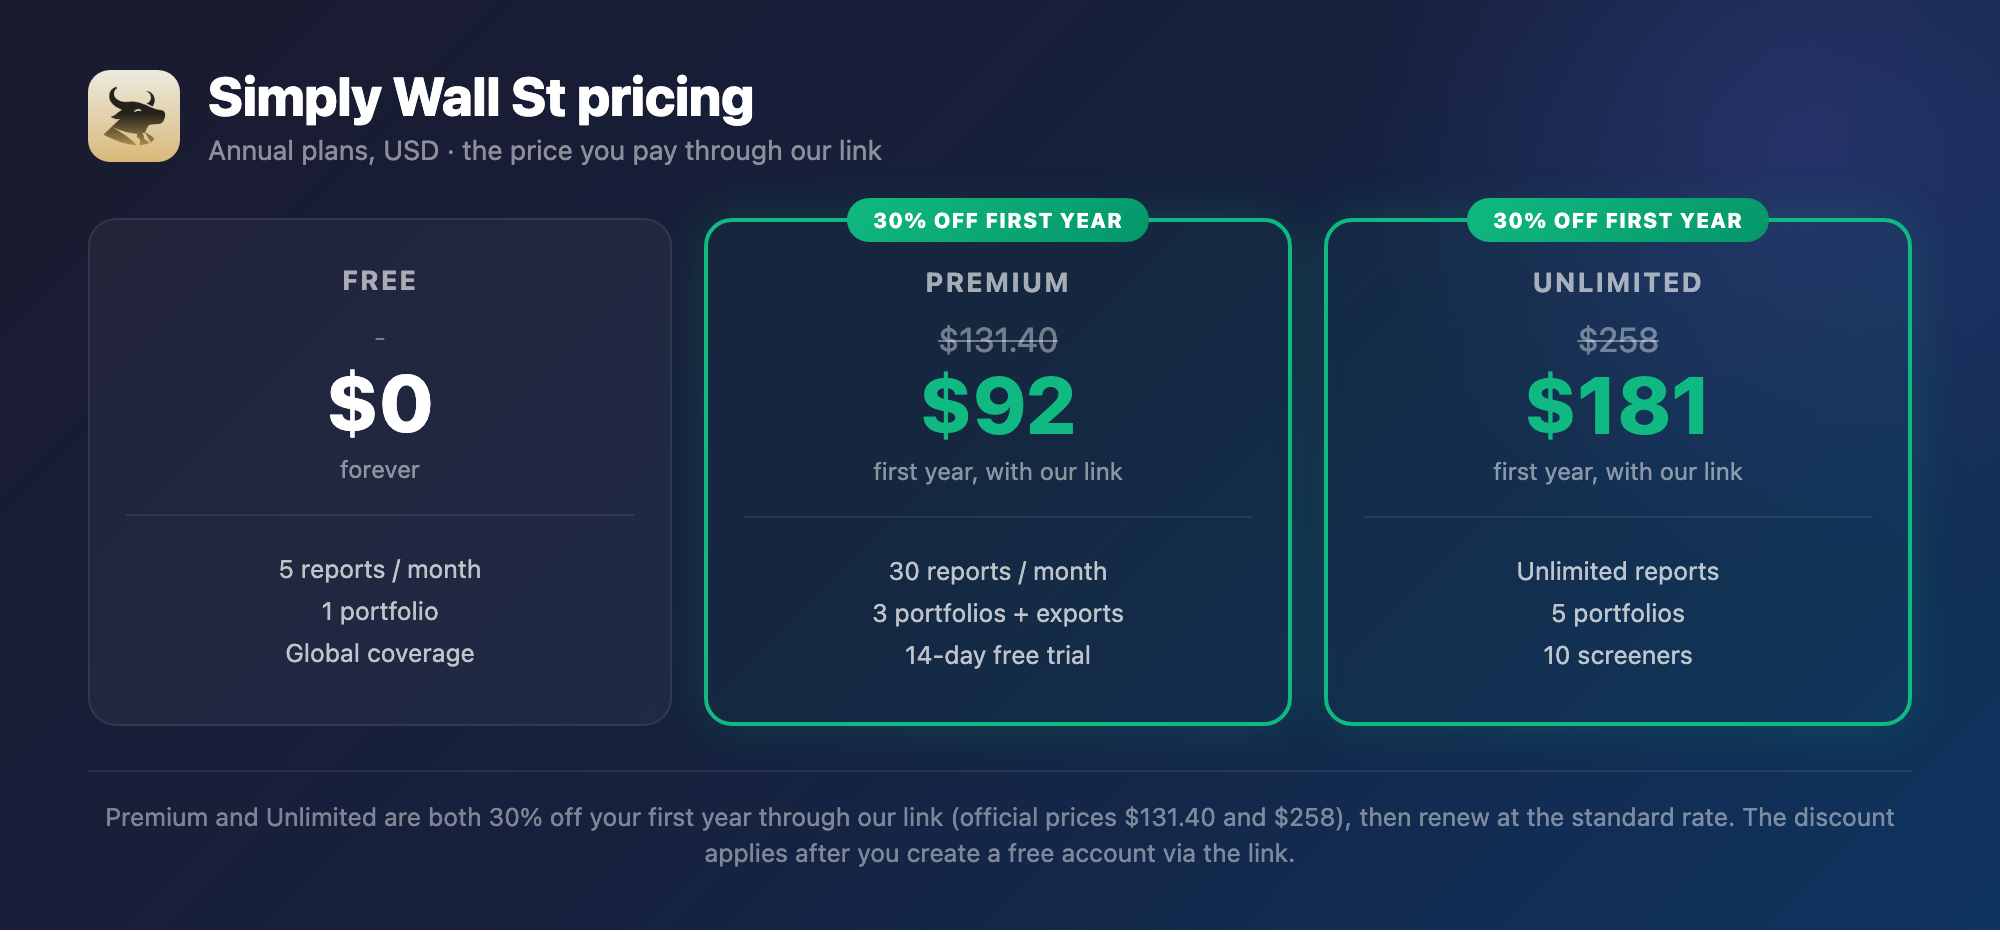
Through our link, new users get 30% off the first year, which brings Premium down to about $92 and Unlimited to about $181 for year one. Here is the part to get right: you will not see the discount while you are logged out, the public pricing page always shows full price. You need to create a free account first through our link, using your real email so you can confirm it with the code they send, and once the account is verified the 30% is unlocked. You then have the 14-day window to upgrade and claim it, with no code to enter. After year one it renews at the standard price.
Simply Wall St vs the alternatives
| Tool | Best for | Curated picks? | Standard / yr |
|---|---|---|---|
| Simply Wall St | Visual analysis, beginners | No, analysis only | $131.40 |
| Seeking Alpha | Deep US research | Yes, Alpha Picks | $299 |
| InvestingPro | Global data & screening | Yes, ProPicks AI | from $114 |
| TipRanks | Analyst consensus & scores | No, ratings | $360 |
The quick version:
- vs Seeking Alpha: Seeking Alpha goes far deeper on research and is US-focused, and its Alpha Picks add-on gives you curated picks. Simply Wall St is the more visual, more global and much cheaper option (Seeking Alpha Premium runs around $299/yr). Different jobs.
- vs InvestingPro: both are global. InvestingPro packs a heavier screener and ProPicks AI, and starts a little cheaper (from around $114/yr, with 15% off via our MMB code). Simply Wall St wins on visual simplicity and the portfolio Snowflake.
- vs TipRanks: TipRanks is built around analyst consensus and its Smart Score; Simply Wall St is built around company fundamentals you can see. Many investors who want analyst signal alongside fundamentals use one of each.
On price, Simply Wall St Premium sits between InvestingPro’s two tiers and well below Seeking Alpha, so it is an affordable, more visual alternative to the heavyweight research suites rather than the cheapest tool on the shelf. For the full picture, see our best stock analysis tools roundup.
How to get started
Claiming the reader discount takes three steps, and the order matters because the price only changes once you are signed up through the link.
Verdict: is Simply Wall St worth it?
For the right investor, yes. If you are a beginner or a visual thinker who wants to understand a company fast, track a global portfolio in one place and screen for ideas without drowning in spreadsheets, Simply Wall St is one of the best-value tools out there, and the free plan lets you try before you pay.
It is not the right pick if you want to build and stress-test your own valuation models, or if you want someone to hand you a vetted list of stocks to buy. For the first you will outgrow it; for the second, Alpha Picks or ProPicks AI are the better fit.
Our rating: 4.6/5. A genuinely useful, well-designed research tool that does one thing better than almost anyone, visual fundamental analysis, held back only by a rigid Fair Value model and the usual renewal small print.
Frequently Asked Questions
Is Simply Wall St worth it?
For beginners and visual investors who want fast, global stock analysis and one-glance portfolio tracking, yes. The free plan covers the basics; Premium (about $92 in year one through our link, then $131.40) is worth it if you research more than a handful of stocks a month. Deep-dive analysts and anyone wanting curated picks will get less from it.
Is Simply Wall St accurate and reliable?
The underlying data comes from S&P Global, so the raw numbers are solid. The analysis on top, especially the Fair Value, is a useful automated interpretation rather than a hand-built model, and occasional lag or generic scoring shows up. Treat it as a strong first-pass filter, not the final word.
Is the free version enough?
For tracking one small portfolio and checking the odd stock, yes. The five-reports-a-month and ten-holding caps are tight, so anyone researching actively will quickly want Premium.
Is Simply Wall St good for beginners?
This is arguably its single biggest strength. Plain-language reports and the visual Snowflake make it one of the easiest ways into stock research, as long as you remember the scores are a starting point, not a buy signal.
Is Simply Wall St legit and safe?
Yes. It is an established platform, around since 2014, used by seven million-plus investors, with a 4.2/5 Trustpilot rating across roughly 4,900 reviews and data sourced from S&P Global.
How is the Fair Value calculated, and can I trust it?
It is based on a discounted-cash-flow estimate of future cash flows. On most plans the inputs are set automatically and can’t be edited, so read it as one informed estimate among several rather than a precise target, and cross-check it against your own view before acting.
Is Simply Wall St better than Seeking Alpha?
They do different jobs. Simply Wall St is more visual, more global and cheaper; Seeking Alpha goes deeper on research and, via Alpha Picks, gives you curated picks. For a fast visual read and global coverage, Simply Wall St wins; for depth and done-for-you picks, Seeking Alpha does. Many investors use both.
Kai is an investor who helps people choose the right broker and invest with confidence. He founded MatchMyBroker, a broker-comparison site for a global audience, and EU Investing Hub, his European-focused investing site. He also runs the Smart Money with Kai YouTube channel, where he breaks down investing, brokers and personal finance.